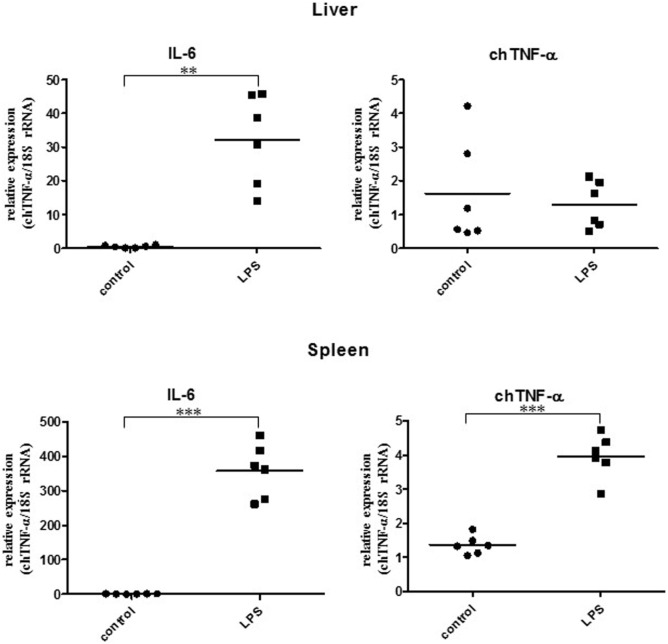
Figure 6.
Relative expression of chicken TNF-α (chTNF-α) and chicken interleukin-6 mRNA in liver and spleen of lipopolysaccharide (LPS) treated and control chicken. Animals were treated with 10 µg LPS/kg BW in PBS for 3 h (n = 6). Control birds received PBS only (n = 6). Cytokine expression was quantified by qRT-PCR. Expression of chTNF-α in response to LPS stimulation in the liver was not significantly different compared to the controls. **p < 0.01; ***p < 0.001 (Student’s t-test).

