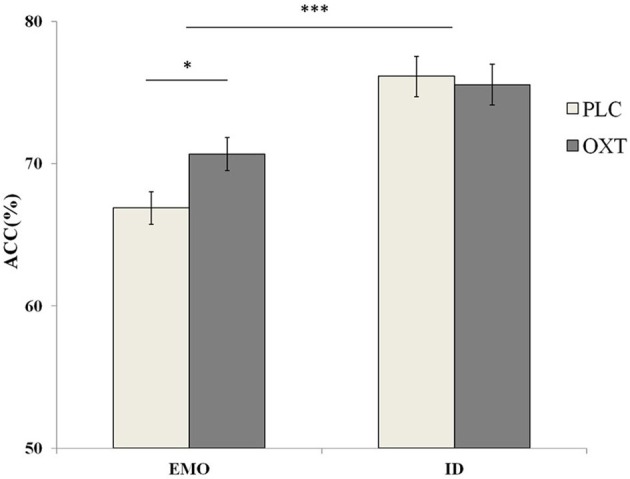
Figure 3.

Behavioral performance (mean ± standard error) during the EMO and ID tasks. Participants were significantly less accurate with the EMO task than the ID task. The OXT group was more accurate with the EMO task than the OXT group. The symbol * indicates significant differences at p < 0.05, and *** indicates significant differences at p < 0.001.
