Figure 5.

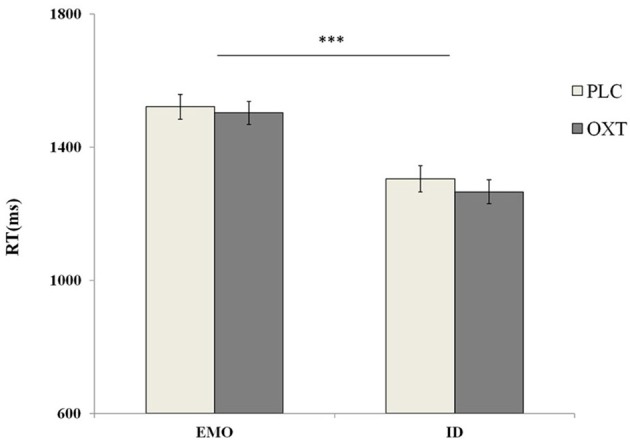
Behavioral performance (mean ± standard error) during the EMO and ID tasks. Participants were significantly slower to respond during the EMO task than the ID task. Here, *** indicates significant differences at p < 0.001.

Behavioral performance (mean ± standard error) during the EMO and ID tasks. Participants were significantly slower to respond during the EMO task than the ID task. Here, *** indicates significant differences at p < 0.001.