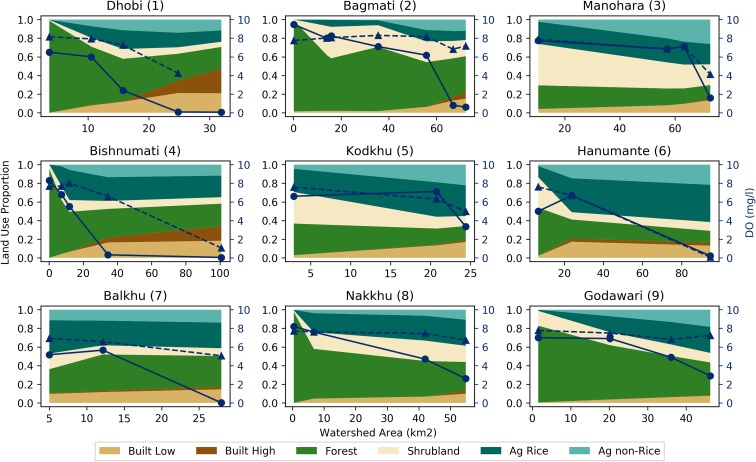
Fig. 8.
Land-use proportions and dissolved oxygen (DO) results for the nine perennial streams in the Kathmandu Valley. Land-use proportions shown for six land-uses classes with reference to the primary (left) vertical axes. DO results in milligrams per liter (mg l−1) shown for 2016 monsoon (dashed line with triangles) and 2017 pre-monsoon (solid line with circles) periods with reference to the secondary (right) vertical axes

