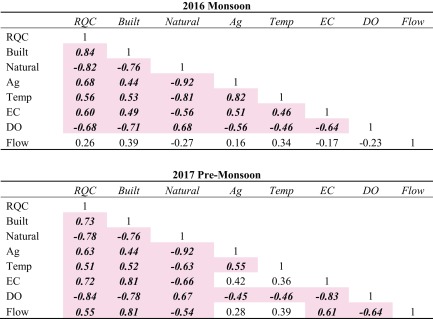
Table 2.
Pearson’s r values between RQC, Built (i.e., sum of Built Low and High), Natural (i.e., sum of Forest and Shrubland), Ag (i.e., sum of Ag Rice and Ag Non-Rice), temperature (Temp), electrical conductivity (EC), dissolved oxygen (DO), and streamflow (FLOW). Statistically significant values (n = 38, p = 0.01, r > 0.430) shown in bold italics with a highlighted background

