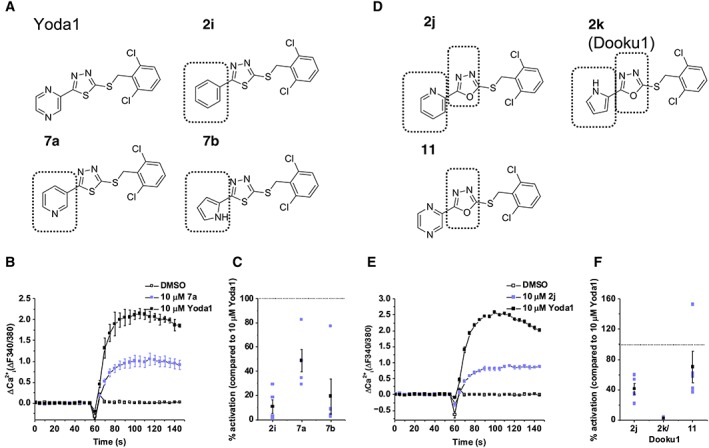
Figure 2.

Changes to the pyrazine ring or replacing the thiadiazole with an oxadiazole give rise to less active analogues. (A) Structures of Yoda1 and analogues with changes to the pyrazine ring. Structural variation to Yoda1 is highlighted by the box outline. (B) FlexStation intracellular Ca2+ measurement data for Piezo1 T‐REx cells exposed to 10 μM 7a or exposed to vehicle only (DMSO). Error bars indicate SEM (N = 3). (C) Summary for experiments of the type shown in (B) measured between 40–60 s after Yoda1 analogue application, expressed as a % of the 10 μM Yoda1 response. Each data point represents a value from an independent experiment with mean values and error bars representing SEM indicated in black (n = 5). (D) Structures of Yoda1 analogues with an oxadiazole. Structural variation to Yoda1 is highlighted by the box outline. (E) FlexStation intracellular Ca2+ measurement data for Piezo1 T‐REx cells exposed to 10 μM 2j or exposed to vehicle only (DMSO). Error bars indicate SEM (N = 3). (F) Summary for experiments of the type shown in (E), as for (C).
