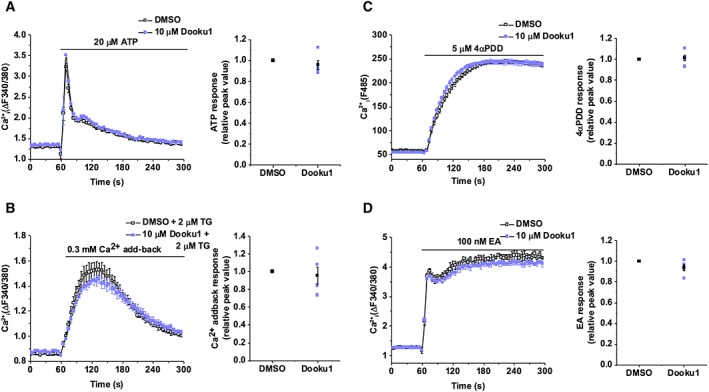
Figure 4.

Selectivity of Dooku1. Ca2+ indicator dyes were fura‐2 (A, B, D) or fluo‐4 (C). Experiments conducted in native HEK 293 cells (A, B), CHO cells overexpressing TRPV4 (C) or HEK 293 cells overexpressing TRPC4 (D). Intracellular Ca2+ measurement data for cells exposed to 20 μM ATP (A), 0.3 mM Ca2+ addback (B), 5 μM 4α‐phorbol 12,13‐didecanoate (4α‐PDD) (C) or 100 nM (‐)‐Englerin A (EA) (D) following pretreatment with DMSO or 10 μM Dooku1 (left). Error bars indicate SEM (N = 3). Summary for experiments of the type shown on the left measured between 10–30 s (A), 60–90 s (B), 220–240 s (C) or 20–60 s (D) after treatment application and normalized to the peak amplitude values for the vehicle only (DMSO) pretreatment condition (right). Each data point represents a value from an independent experiment with mean values and error bars representing SEM indicated in black (n = 5).
