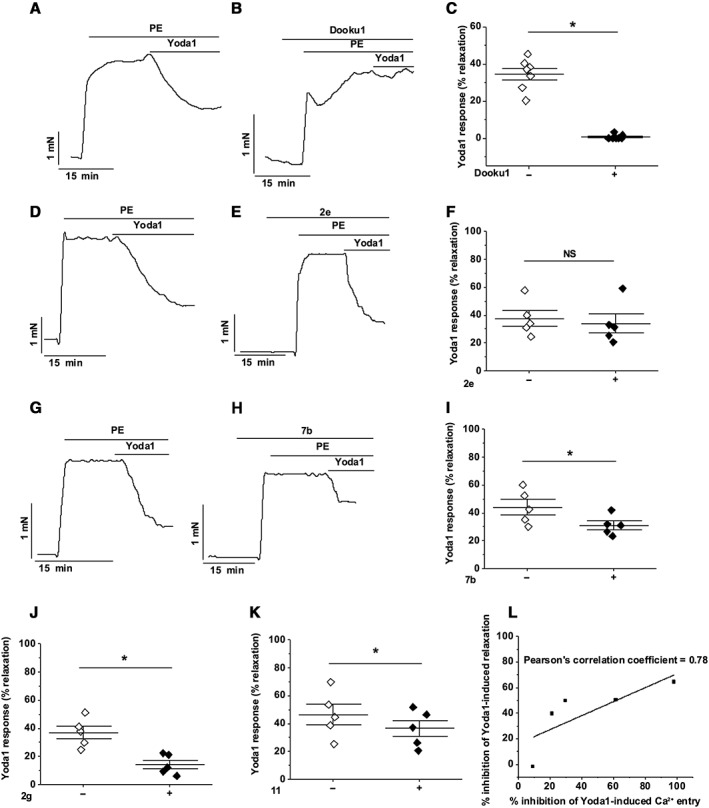
Figure 8.

Dooku1 inhibits Yoda1‐induced dilation in aorta. (A–K) Isometric tension data from mouse thoracic aorta with intact endothelium. (A) Pre‐constricted with PE and exposed to 5 μM Yoda1. (B) As for (A) but following 30 min pre‐incubation with 10 μM Dooku1. (C) Summary data for experiments of the type shown in (A, B) expressed as % relaxation evoked by Yoda1. Each data point represents a value from an independent experiment with mean values and error bars representing SEM indicated by the black lines (n = 7). (D–F) (G–I) As for (A–C) but following pre‐incubation with 10 μM 2e (D–F) or 7b (G–I) (n = 5 on F, I). (J, K) As for (C) but following pre‐incubation with 10 μM 2g (J) or 11 (K) (n = 5). (L) Comparison of the mean % inhibition of Yoda1‐induced relaxation in mouse thoracic aorta and the mean % inhibition of Yoda1‐induced Ca2+ entry by the five compounds: 2e, 2g, Dooku1, 7b and 11. The points are fit to a straight line with Pearson's correlation coefficient of 0.78.
