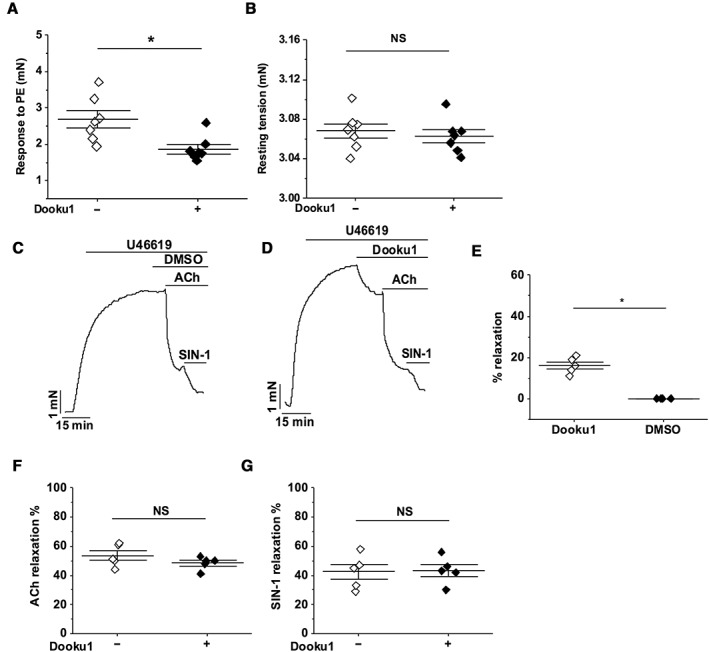
Figure 9.

Specificity of Dooku1 in aorta. All experiments were performed on mouse thoracic aorta with intact endothelium. (A, B) Summary data for experiments of the type shown in Figure 8A, B, expressed as the response to PE (A) or resting tension (B) before and after pre‐incubation with 10 μM Dooku1. Each data point represents a value from an independent experiment with mean values and error bars representing SEM indicated by the black lines (n = 7). (C) Aorta were pre‐constricted with 0.1 μM U46619 and treated consecutively with DMSO, 1 μM ACh and 10 μM SIN‐1. (D) As for C but pretreated with Dooku1 instead of DMSO. (E–G) Summary data for experiments of the type shown in (C, D) expressed as % of the effect of Dooku1 on the contraction by U46619 (E) or % relaxation evoked by ACh (F) or SIN‐1 (G) before and after pre‐incubation with 10 μM Dooku1. Each data point represents a value from an independent experiment with mean values and error bars representing SEM indicated by the black lines (n = 5).
