
Figure 4.
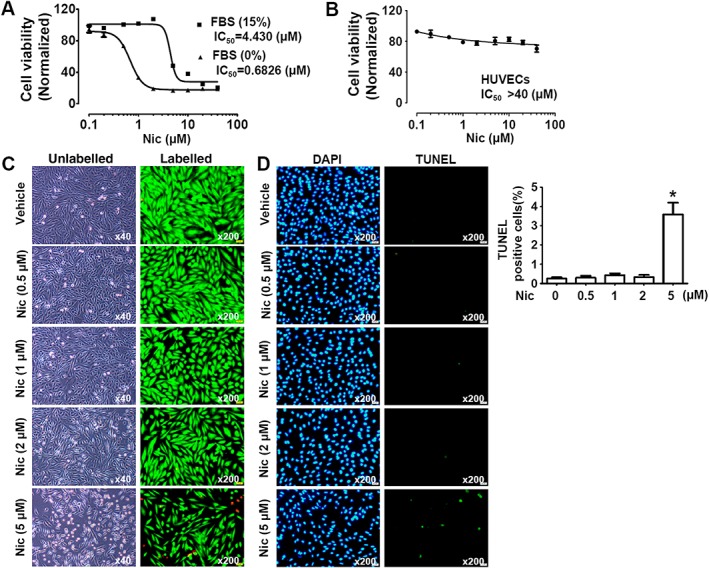
Effects of niclosamide on cell viability. (A) Effects of niclosamide (Nic) on A10 cell viability evaluated by MTT method. The IC50 value was measured under FBS‐free and 15% FBS conditions. n = 6 in each group. (B) Effects of niclosamide on cell viability of HUVECs evaluated by MTT method. The IC50 value was assessed under 15% FBS conditions. n = 6 in each group. (C) The cytotoxicity of niclosamide on A10 cells was evaluated by using the LIVE/DEAD Viability/Cytotoxicity® Assay. The live cells were stained green with calcein AM, and the dead cells were stained red with EthD‐1. The cells were cultured under 15% FBS conditions. (D) High dose of niclosamide (5 μM) induced A10 cell apoptosis. The cells were cultured under 15% FBS conditions. Cell apoptosis was evaluated using TUNEL staining. Quantitative data show the percentage of TUNEL‐positive cells from total number of cells. n = 11 in each group. *P < 0.05, significantly different from untreated cells (control).