
Figure 5.
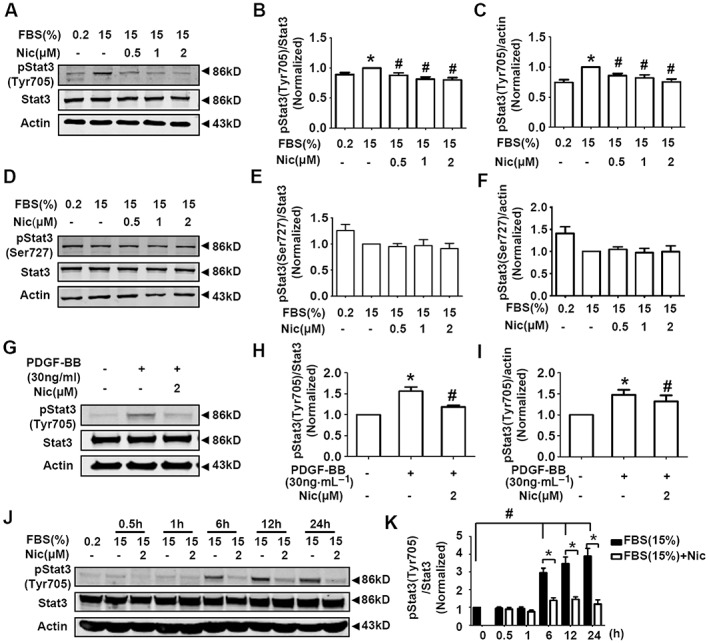
Niclosamide suppresses serum‐induced (15% FBS) and PDGF‐BB‐induced STAT3 activation in A10 cells. (A–C) Serum‐starved A10 cells were grown in DMEM supplemented with 0.2% FBS or 15% FBS in the absence or presence of niclosamide (Nic; 0.5–2 μM) for 24 h. Representative images of the protein levels of STAT3 Tyr705 phosphorylation were shown in (A). STAT3 Tyr705 phosphorylation level was normalized to that of total STAT3 protein level in (B), and STAT3 Tyr705 phosphorylation level was normalized to that of actin protein level in (C). n = 15 in each group. *P < 0.05, significantly different from 0.2% FBS (control), # P < 0.05, significantly different from 15% FBS. (D–F) Serum‐starved A10 cells were grown in DMEM supplemented with 0.2% FBS or 15% FBS in the absence or presence of niclosamide (0.5–2 μM) for 24 h. Representative images of the protein levels of STAT3 Ser727 phosphorylation were shown in (D). STAT3 Ser727 phosphorylation level was normalized to that of total STAT3 protein level in (E), and STAT3 Ser727 phosphorylation level was normalized to that of actin protein level in (F). n = 13 in each group. (G–I) A10 cells were exposed to PDGF‐BB (30 ng·mL−1) in the absence or presence of niclosamide (2 μM) for 30 min. The control medium contains 0.2% FBS. Representative images of the protein levels of STAT3 Tyr705 phosphorylation were shown in (G). STAT3 Tyr705 phosphorylation level was normalized to that of total STAT3 protein level in (H), and STAT3 Tyr705 phosphorylation level was normalized to that of actin protein level in (I). n = 8 in each group. *P < 0.05, significantly different from 0.2% FBS (control), # P < 0.05 versus PDGF‐BB. (J, K) Serum‐starved A10 cells were cultured in DMEM supplemented with 15% FBS in the absence or presence of niclosamide (2 μM). The incubation time was set as 0, 0.5, 1, 6, 12 and 24 h. Representative images of the protein levels of STAT3 Tyr705 phosphorylation were shown in (J). STAT3 Tyr705 phosphorylation level was normalized to that of total STAT3 protein level in (K). n = 10 in each group. *P < 0.05, significantly different from FBS (15%); # P < 0.05, significantly different from 0 h (0.2% FBS).