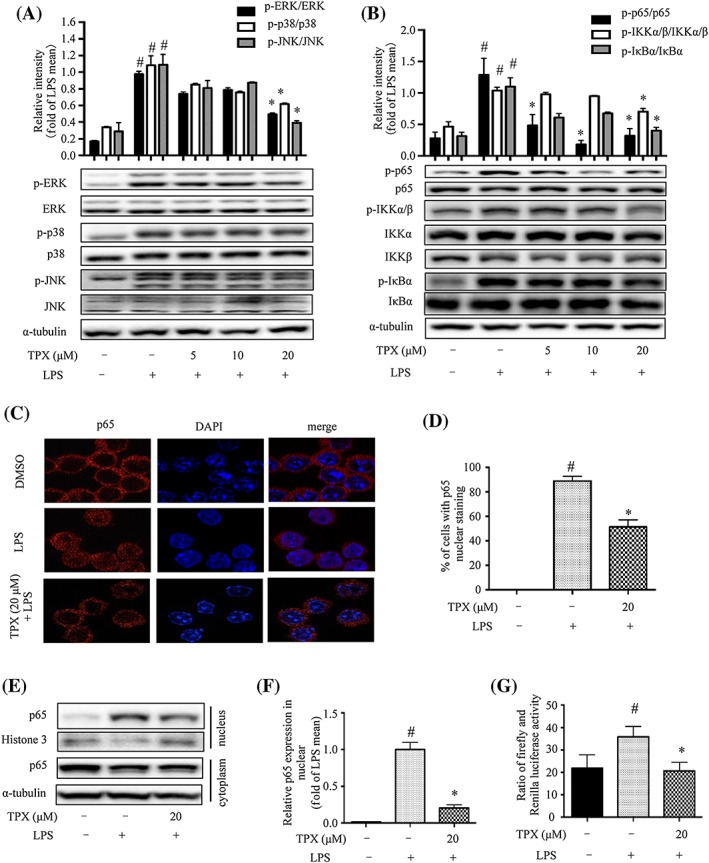
Figure 2.

TPX blocked MAPK phosphorylation and inhibited NF‐κB activity in LPS‐treated RAW264.7 macrophages. Cells were treated with TPX in the absence or presence of LPS (1 μg·mL−1) for the indicated time. (A) The protein levels of phospho‐ERK, ERK, phospho‐p38, p38, phospho‐JNK and JNK were detected by Western blot analyses (n = 6). α‐Tubulin was used as internal loading control. Data were normalized to the mean value of the LPS group. (B) The protein levels of phospho‐IKKα/β, IKKα, IKKβ, phospho‐IκBα, IκBα, phospho‐p65 and p65 were detected by Western blot analyses (n = 6). α‐Tubulin was used as internal loading control. Data were normalized to the mean value of the LPS group. (C) Cells were pretreated with or without TPX (20 μM) for 1 h and then exposed to LPS (1 μg·mL−1) for another 1 h. The immunostaining of p65 was detected. Nuclei were stained with DAPI. (D) The percentage of cells undergoing p65 nuclear translocation was quantified (n = 6). (E) The protein level of p65 in nuclear and cytoplasmic fractions was determined by Western blotting. Histone 3 and α‐tubulin were used as internal loading controls. (F) The relative expression of p65 in the nuclear fraction was quantified (n = 6). Data are normalized to the mean value of LPS group. (G) RAW264.7 cells were co‐transfected with a NF‐kB luciferase reporter gene and pRL Renilla luciferase control reporter vector, then the cells were pretreated with TPX for 1 h followed by activation with LPS for 1 h. The transcriptional activity was expressed as the ratio of firefly to Renilla luciferase intensities in the cell lysates (n = 6). Data are expressed as means ± SEM. # P < 0.05 versus DMSO, * P < 0.05 versus LPS.
