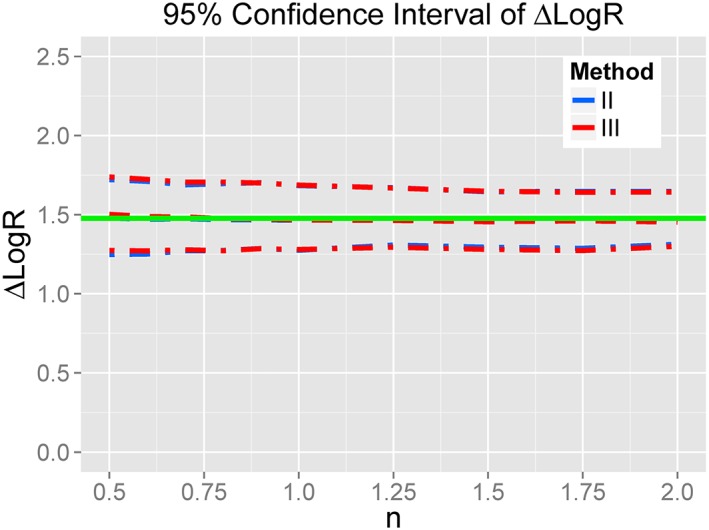
Figure 2.

Values of Δ log (R), with its 95% CI, over different values of n. The green line shows the true value. Dashed line indicates the median estimated value and the dash‐dot line the 95% CI of estimated value. Blue indicates the method of assigning KA to measured values from binding assay (method II); red indicates the method of arbitrarily fixing KA of full agonists to 1 (method III). The successful estimation rates of three methods were all higher than 95%.
