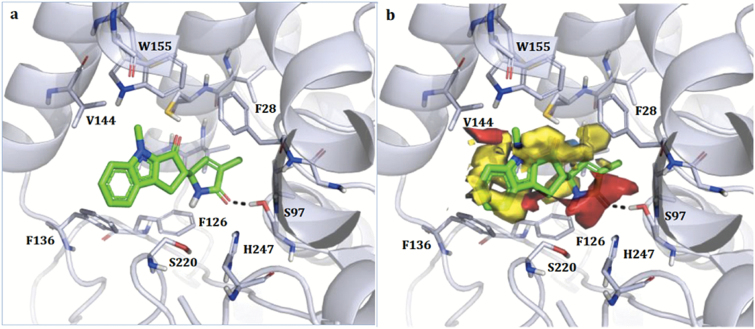
Fig. 8.
Docking models of rac-9 in the binding site of rice D14. Only the SS enantiomer is shown. (A) Crystallographic pose. The ligand and the residues lining the pocket are shown as coloured regions. Hydrogen bonds are represented as black dashed lines. The protein is represented as a simplified model. Residues 158–166 have been removed for clarity, and only the residues closest to the ligand are labelled. (B) Molecular Interaction Fields as calculated using FLAP (Baroni et al., 2007; Spyrakis et al., 2015). Red, blue, and yellow indicate the hydrogen-bond acceptor, hydrogen-bond donor, and hydrophobic Molecular Interaction Fields, respectively.

