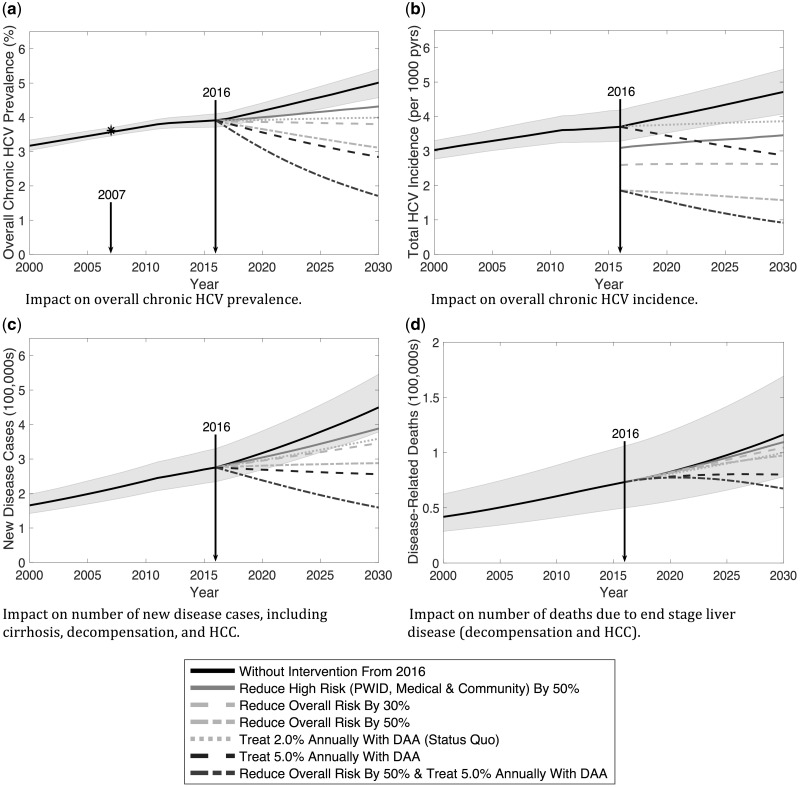
Figure 3.
Projections of the 15-year impact from 2016-2030 of interventions reducing either high or all transmission risks and/or treating a percentage of chronically infected individuals annually. Intervention scenarios are described in Table 1. The solid black line and shaded grey areas show the median and 95% credible intervals for the epidemic projections at baseline without treatment interventions from 2016. Median curves for the various interventions are as indicated.

