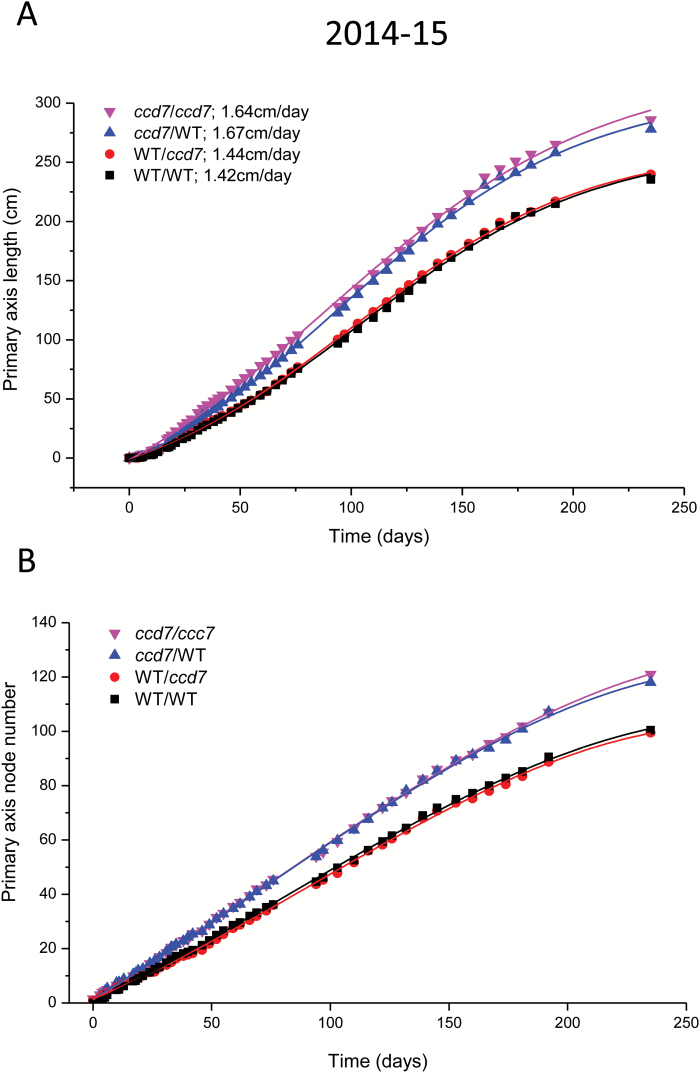
Fig. 7.
Growth of the primary axis for each ‘Royal Gala’ apple graft combination (scion/rootstock) in 2014–2015. Growth was measured in terms of increase in (A) primary axis length and (B) node number over the growing season. The maximum growth rate (cm d–1) was estimated by fitting a Boltzmann function to the smoothed growth data and is listed after each symbol in the key. WT, wild-type ‘Royal Gala’.

