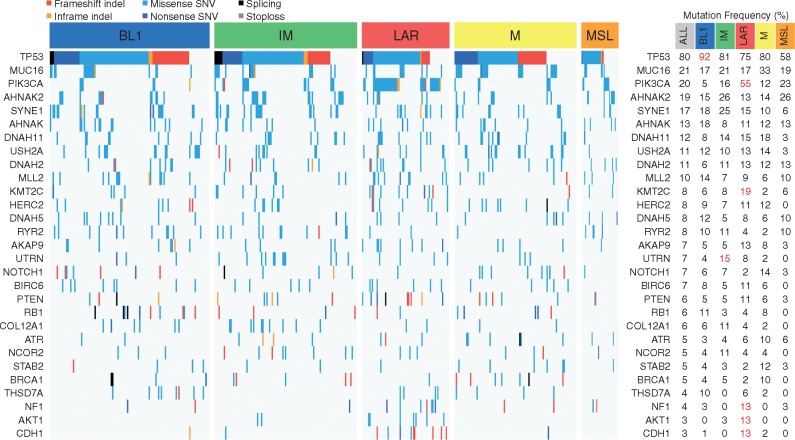
Figure 1.
Mutational landscape of TNBC molecular subtypes. Frequencies of mutations across each TNBC molecular subtype according to the different types of mutations. Only genes mutated at a frequency >10% in at least one subtype are displayed. Significant differences (FDR < 0.05) are shown in red (right panel).

