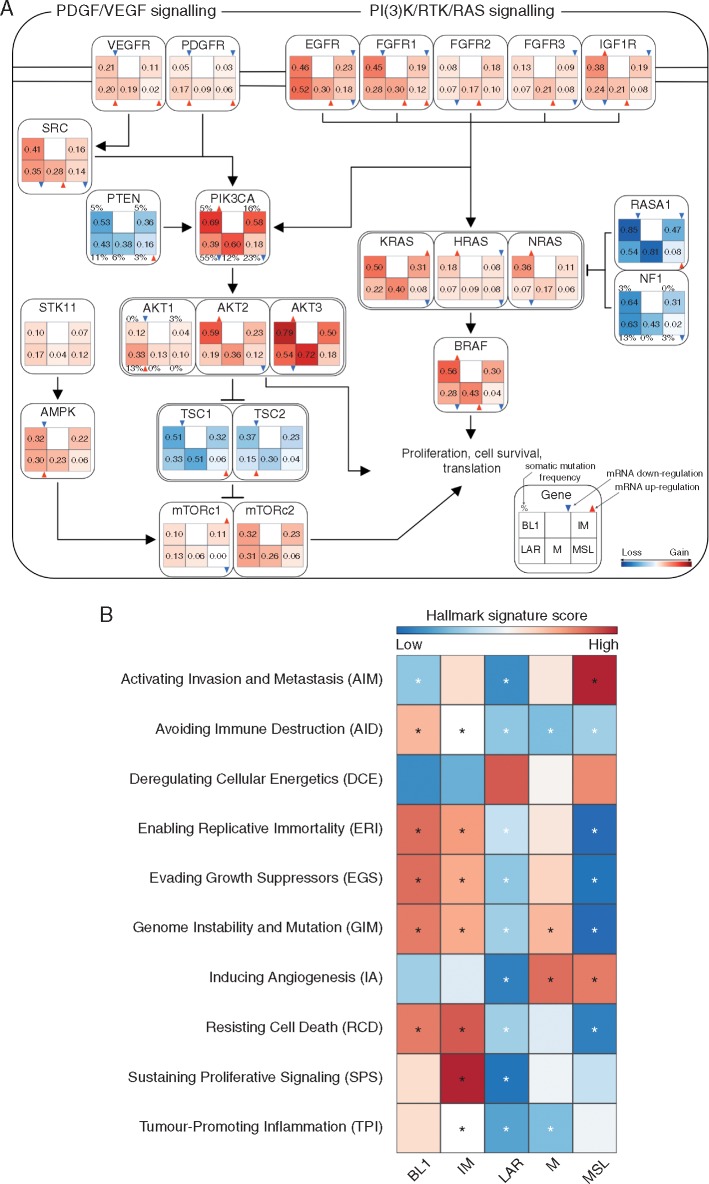
Figure 3.
Altered signalling pathways and deregulated hallmarks of cancer signatures within each TNBC molecular subtype. (A) Genomic and transcriptomic alterations profiles involving PDGF/VEGF and PI(3)K/RTK/RAS signalling pathway. Copy-number frequency is reported for each TNBC molecular subtype inside each box. Copy number gain frequency is presented in red while copy number losses are in blue. Differences in mRNA expression were tested using one-sided Wilcoxon Rank Sum test with P-values corrected for multi-testing. Significant mRNA upregulation and downregulation were displayed using, respectively, red and blue triangles. Somatic mutation frequency is reported, when available, on top of each TNBC molecular subtype. (B) Heatmap of the 10 Hallmarks of cancer meta-gene signature scores for the TNBC molecular subtypes. Differences were reported using one-sided Wilcoxon Rank Sum test with P-values corrected for multi-testing. Significant differences were reported for FDR lower than 5% (significant up-regulation are displayed in black and down-regulated in white).

