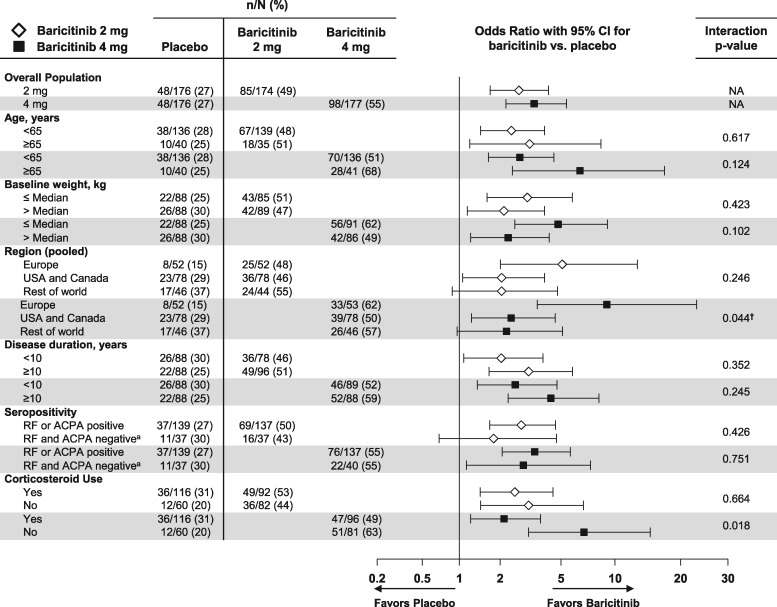
Fig. 1.
Percentage of patients achieving ACR20 response at week 12: patient demographic and clinical characteristics subgroups
Data (non-responder imputation) are presented as n/N (%). †The interaction of treatment with subgroup is significant (P ≤ 0.1) at both weeks 12 and 24. aFor determining seropositivity status, the ACPA-negative group includes patients with negative (≤7 U/ml) and indeterminate (>7 and ≤10 U/ml) values. N: number of patients in the specified subgroup; n: number of patients in the specified category; NA: interaction analysis not applicable.

