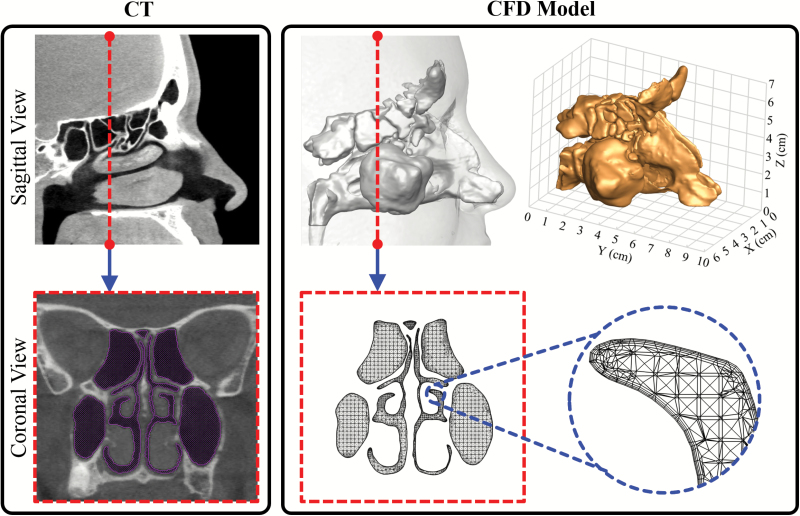
Figure 2.
CT-based computational model. Side-by-side comparison of the CT scan and CFD model from sagittal and coronal views, respectively. The dashed line indicates the slice cut on the sagittal plane. The perspective view of the 3D model and its dimensions are shown on the right top plot. In a close-up view (right bottom), layers of small and fine elements along the wall can be seen; these capture the rapid near wall changes of air velocity and odorant concentration and are essential for accurate numerical simulations.

