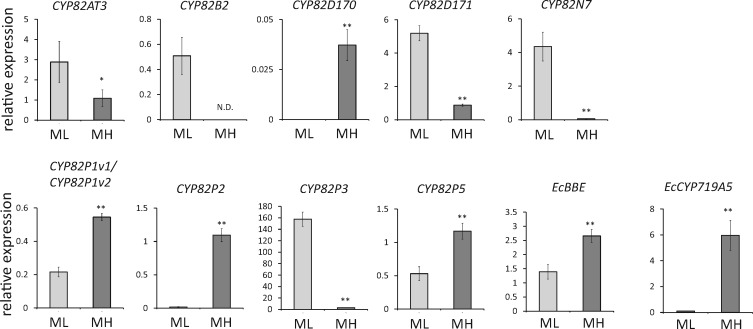
Fig. 3.
Expression analysis of novel P450 genes in cultured E. californica cells. Transcript expression was measured by quantitative real-time PCR using the cDNAs of macarpine ML/MH cultured cells. The relative expression levels were calculated by against the values of the β-actin gene. Error bars indicate the SD calculated from three technical replicates. *P < 0.05, **P < 0.01 (statistical analysis followed by the t-test).

