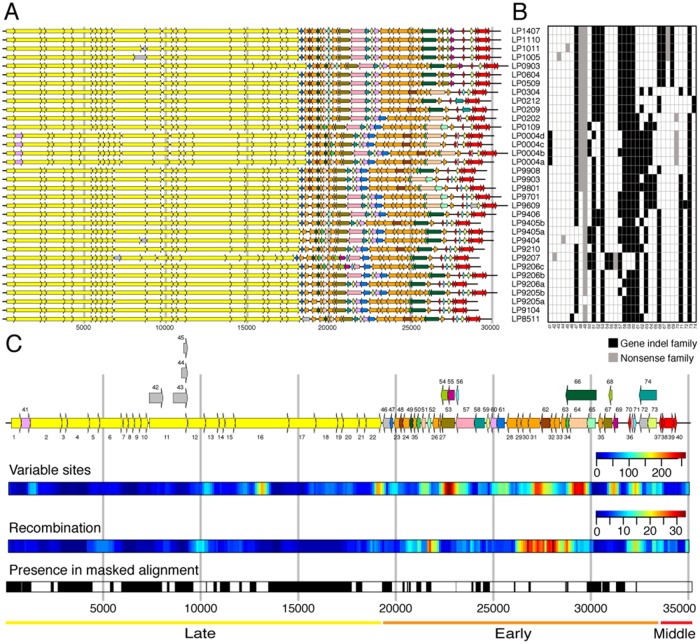
Fig. 5.
Distribution of protein families along the genome. (A) Genome annotation. (B) Presence–absence matrix of variable protein families. Based on maximum parsimony, 25 gain and 42 loss events are inferred for gene indel families. (C) Consensus genome annotation based on the whole-genome alignment. Protein family numbers of core clusters are denoted below the genes, which are colored yellow (late region), orange (early region), and red (middle region). Protein family number of variable clusters is denoted above the gene. Singleton clusters are colored in gray. Overlapping variable genes are plotted in parallel. Several properties are shown aligned to the consensus genome annotation: Variable sites—sliding window analysis (width 500 bp, offset 100 bp) of number of columns having multiple nucleotides; Recombination—sliding window analysis (width 500 bp, offset 100 bp) of the number of recombination events in each window; presence in masked alignment—positions included in the masked alignment are colored in black. Diversity varies along the genomes. The early region is most diverse in terms of gene content and nucleotide differences. This region is also most affected by recombination. In contrast, the late region is very conserved. In accordance with previous observations (Mahony et al. 2012), we also found hotspots of diversity among the structural genes in regions that overlap with the genes for the tail length tape measure protein (family 16) and the phage lysin (family 22).

