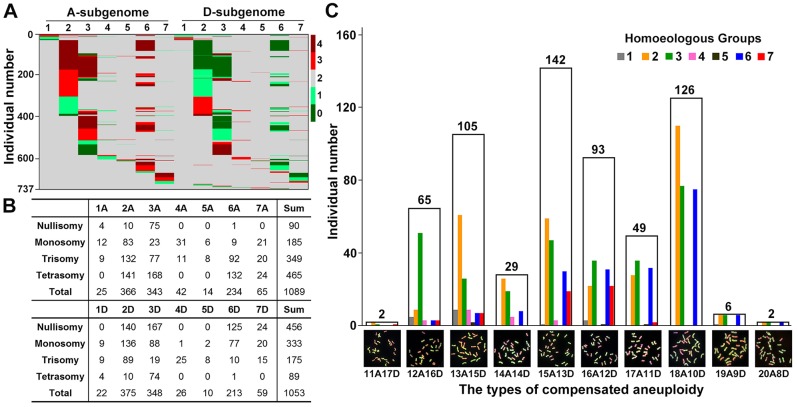
Fig. 2.
NCVs in the 1,462 karyotyped cohorts, differential propensities for NCVs across the 14 chromosomes, and distribution of chromosome constitutions of 619 “compensated” aneuploidies (2n = 28) identified among the total karyotyped cohorts, at the 12th selfed generation (S12) of the allotetraploid wheat. (A) A heatmap depicting gain or loss of whole-chromosome copies among the 14 chromosomes of the A and D subgenomes. (B) Distribution of the numbers of plants showing variable copies (from 0 to 4) of each of the 14 chromosomes. (C) Number of plants with differential chromosome constitutions of the 619 “compensated” aneuploidies (fig. 1C) with concerted whole-chromosome gain and loss, thus maintaining a total chromosome number of 2n = 28. In both (A) and (C), the y-axes denote individual numbers. The numbers above the white columns in (C) refer to plant individuals belonging to each of the designated “compensated” aneuploid types. The colored vertical bars refer to the numbers of plant individuals falling to each of the seven homeologous chromosome groups within each of the “compensated” aneuploid types. GISH images (green and red colorations denote for chromosomes of subgenomes A and D, respectively) of one representative individual for each of the 10 identified types of “compensated” aneuploidies were shown.

