Fig. 4.
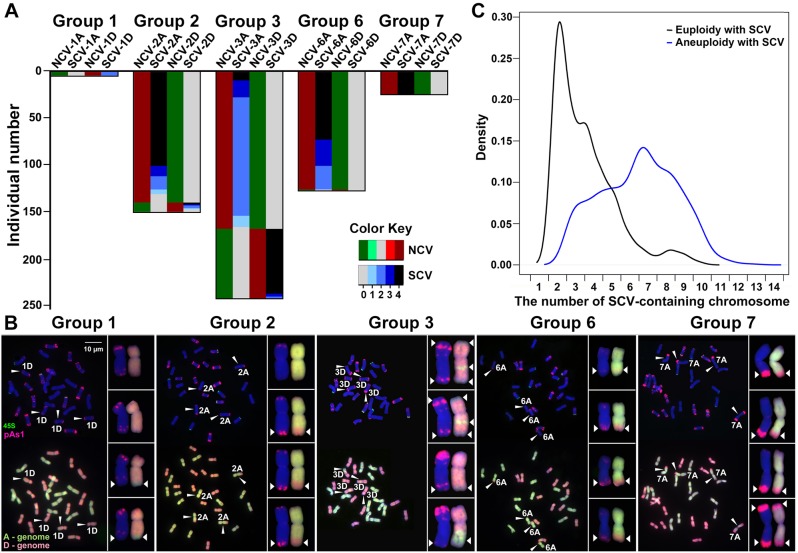
Concurrence of numerical and structural chromosome variations (NCVs and SCVs). (A) Numbers of plant individuals among a total of 544 (y-axis) showing nullisomic–tetrasomic chromosome configurations for each of the five homeologous chromosome groups, that is, 1, 2, 3, 6, and 7 (no plant was found to show a nullisomic–tetrasomic configuration for homeologous chromosome groups 4 and 5) and the number of plants in each homeologous chromosome group with concurrent NCVs and SCVs (the relative proportions were detailed in supplementary table S2, Supplementary Material online). The color keys were denoted the chromosomal copy number. (B) Examples for each of the five homeologous chromosome groups showing concurrent NCVs and SCVs. One to all four copies of the tetrasomic chromosomes carrying translocated chromosomal segments (most likely from their homeologous counterparts) are denoted by arrowheads and highlighted in the insets. (C) A density plot showing the distribution of restructured chromosomes harbored by all the euploid individuals (euploidy with SCVs, n = 461) versus all the aneuploid individuals (aneuploidy with SCVs, n = 714) identified from the 1,462 karyotyped cohorts, which are significantly different (F-test, P = 3.31E−11). The x-axis refers to the number of SCV-containing chromosomes by each of the individuals belonging to either of the two groups.

