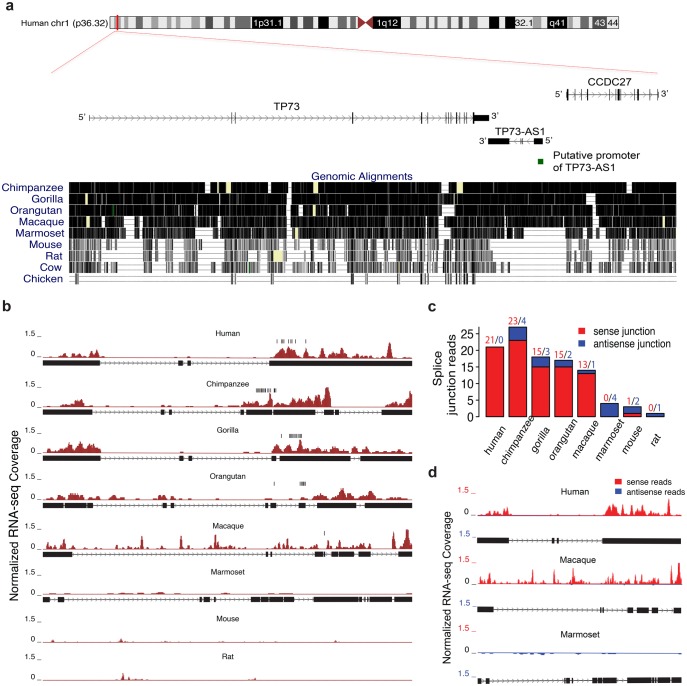
Fig. 3.
The sequence and RNA-seq read profile of TP73-AS1 transcript across species. (a) The sequence conservation of the genomic region containing TP73-AS1, CCDC27, and TP73 based on the genome alignment across 10 species. Each gene is represented by its longest isoform. The green box shows the location of the putative promoter region of TP73-AS1. (b) TP73-AS1 RNA-seq read profile shown as normalized RNA-seq coverage (dark red) and orthologous transcript structure. The orthologous regions in mice and rats are drawn based on genomic synteny. The vertical black bars indicate the location of the predicted miR-941 binding sites. (c) TP73-AS1 transcription in the eight species calculated based on reads that cross the splice junction within TP73-AS1 transcript in either sense (red) or antisense (blue) orientation. (d) TP73-AS1 RNA-seq read profile in humans, macaques, and marmosets, estimated using normalized RNA-seq coverage of sense and antisense reads based on strand-specific RNA-seq data.

