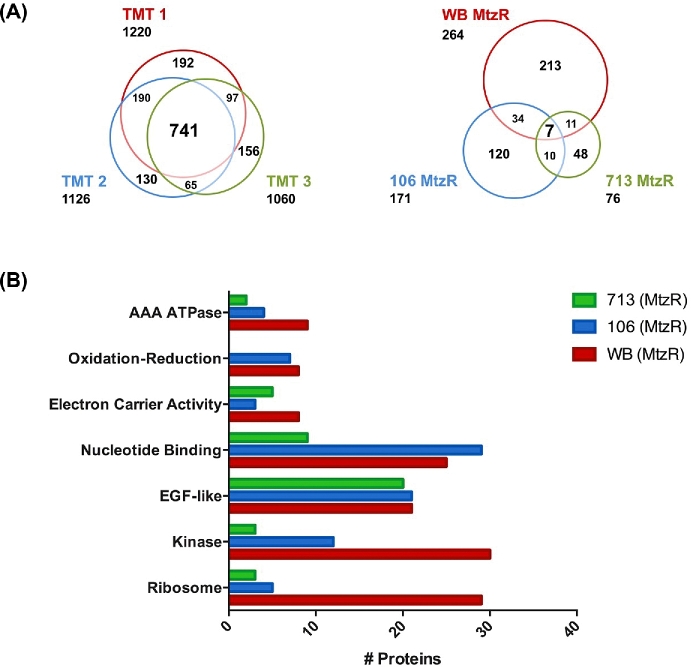
Figure 1:
Protein identification, differential expression, and functional enrichment in Mtz lines. Proportional Venn diagrams showing unique and overlapping protein identifications in the 3 TMT 10-plexes (left) and for differentially expressed proteins in each MtzR line compared to MtzS parents (right). (B) The 6 functional clusters identified as enriched from differentially expressed proteins identified in MtzR isolates and their total protein number.

