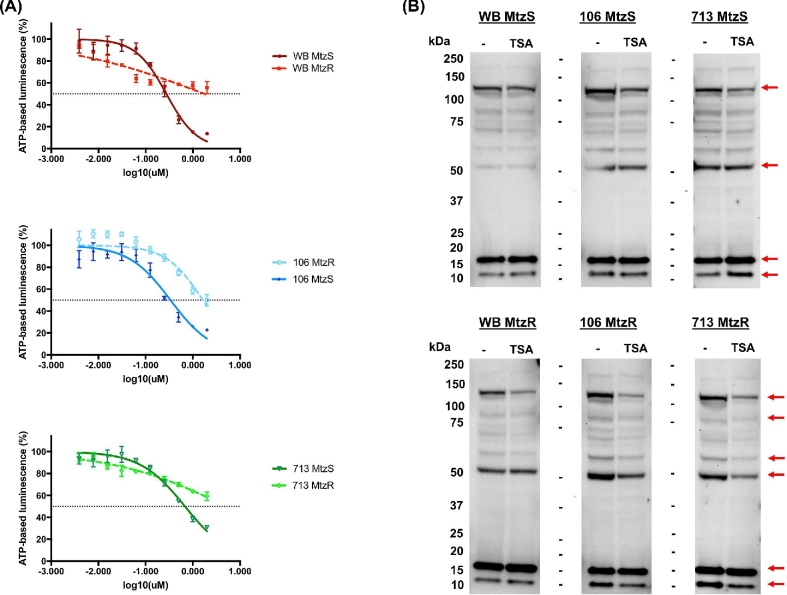
Figure 6:
Results of trichostatin A exposure in MtzS and MtzR lines. (A) Dose–response curves for MtzR and MtzS lines of WB, 106, and 713 to deacetylase inhibitor TSA. Error bars represent ±1 standard deviation; experiments were performed in triplicate. (B) Western blots for total protein lysate from trophozoites (10 μg) exposed to TSA from WB, 713, and 106 MtzS and MtzR lines probed with antibodies against acetylated lysine (KAc). Trophozoites were exposed for 18 hours to 2 μM TSA, with control flasks exposed to the same volume DMSO as used as a vehicle for TSA exposure. Red arrows designate protein features with significant changes between TSA exposed and control trophozoites in the 6 lines.

