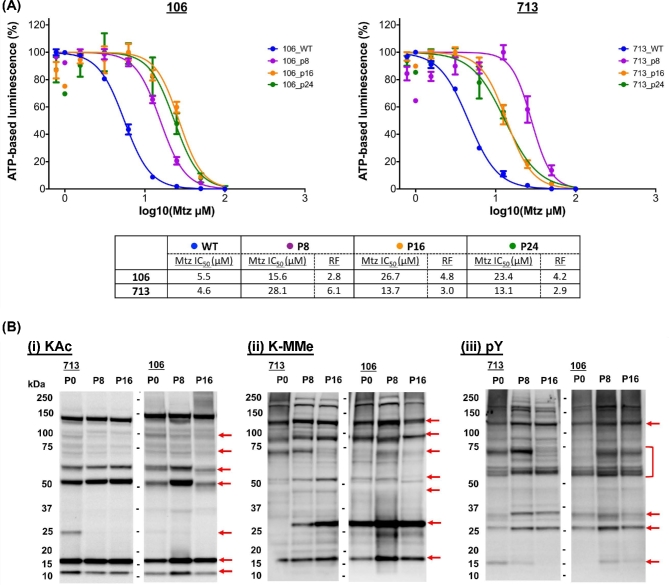
Figure 7:
IC50 profiles and post-translational modifications upon discontinuation of Mtz selection. (A) Dose–response curves for MtzR lines of 106 and 713 upon discontinuation of drug selection at 4 (P8), 8 (P16), and 12 (P24) weeks compared to MtzS lines. MtzS lines were used and are designated 106_WT and 713_WT. Error bars represent ±1 standard deviation; experiments were performed in triplicate. The table records the calculated IC50 for each time point, with resistance factors calculated against the IC50 of the MtzS parent isolate. (B) Western blots against lysate from trophozoites (15 μg) from 713 and 106-MtzR (P0) and 4 (P8), 8 (P16) after discontinued drug selection was probed with antibodies against acetylated lysine (KAc), mono-methylated lysine (K-Mme), and phosphorylated tyrosine (pY). Altered features within 713 and 106 lines are designated on the right of the blot using a solid red arrow. Exposure times have been reduced by 20% to prevent overexposure of major bands (e.g., histone variants).

