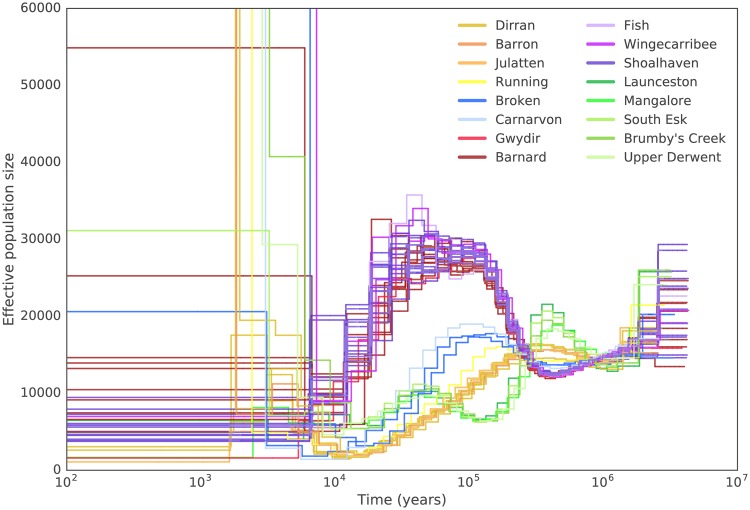
Fig. 5.
Historical effective population sizes inferred using PSMC. Each line represents a single individual with lines colored according to sampling location. Trajectories were scaled using g = 10 and μ = 7 × 10⁻⁹. Effective population size was truncated at 60,000. Samples from a similar sampling location show very similar trajectories.

