Fig. 3.

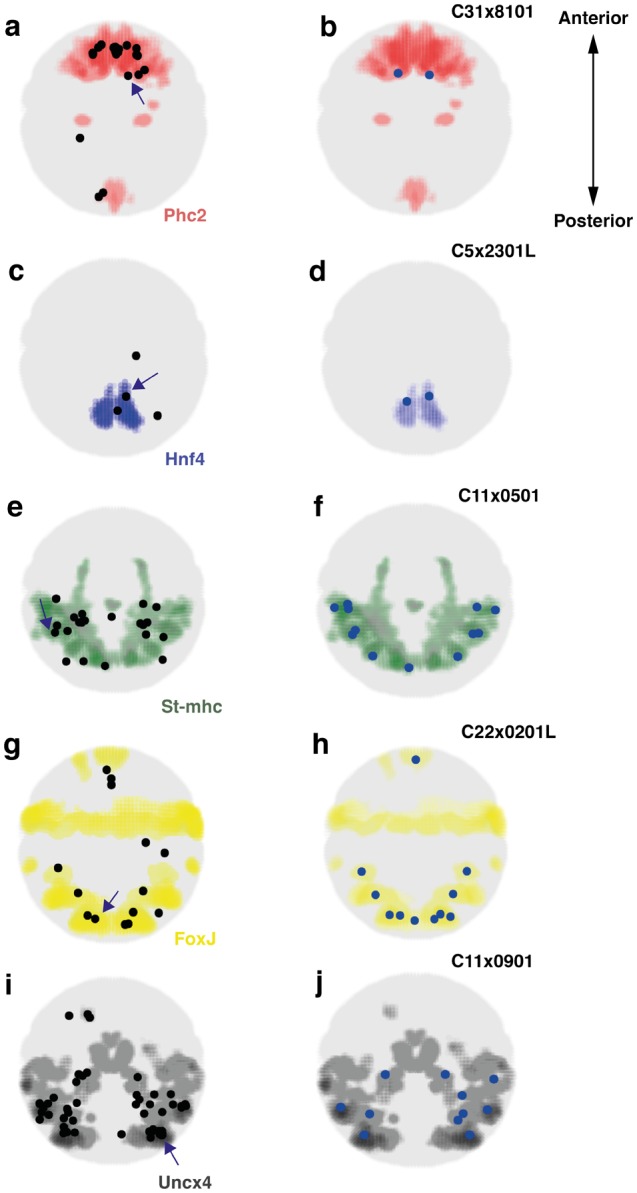
Spatial mapping of single cells to spatially coherent regions characterized by specific marker gene expression. Expression of specific marker gene expression visualized as colored regions within the larva in ventral views. Left panels: Mapping results for all cells belonging to the respective group. Centroids of the voxel clusters to which cells mapped with highest confidence are shown as black dots. Right panels: For each cell group, we show an example of the mapping result for one individual cell (indicated by an arrow on the left panel). (a) Cells of the apical ectoderm group (n=23 cells) map to the Phc2 expressing region in the embryo. (b) Mapping result for the cell C31x8101. (c) Midgut cells (n=4 cells) map to the Hnf4 expressing region. (d) Mapping result for the cell C5x2301L. (e) Striated musculature cells (n=23 cells) map to the St-mhc expressing region. (f) Mapping result for the cell C11x0501. (g) Cells of the ciliary bands (n=14 cells) map to the Foxj expressing region. (h) Mapping result for the cell C22x0201L. (i) Cells of the nonapical ectodermal group (n=55 cells) map to the Uncx4 expression domain. (j) Mapping result for the cell C11x0901.
