
Table 6.
Summary of genotypic trait variability using differencing of high density intervals (HDI).
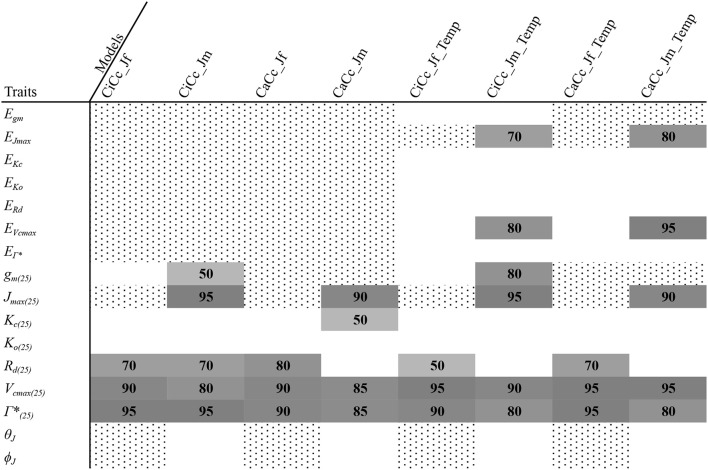 |
Dot-pattern indicates traits not in a given model. White indicated no emergence of HDI difference at 50% HDI. Number indicates at which HDI percentile did the difference in posterior distributions no longer overlap with zero. Color coding from dark for largest HDI percentile (95) to light for smallest (50).