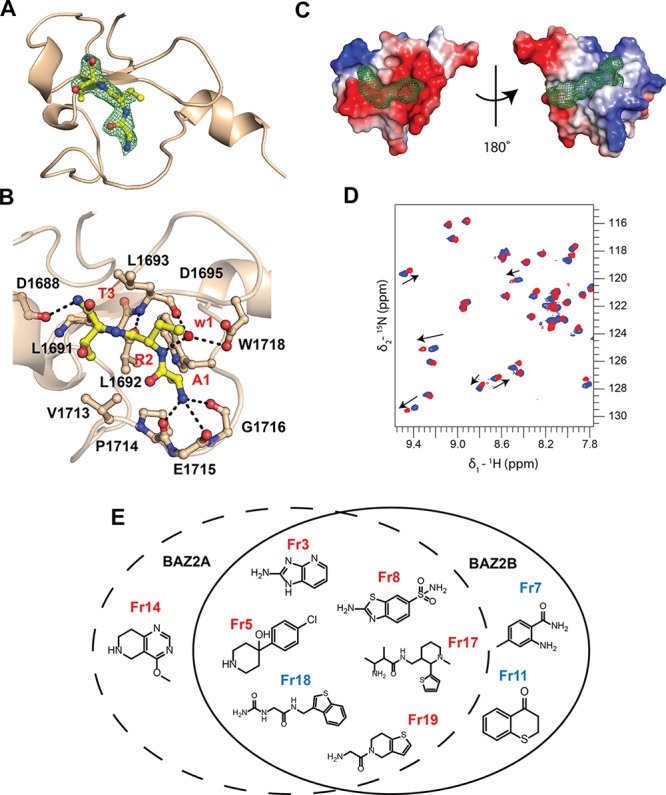
Figure 1.

Druggable pockets on BAZ2A/B PHD and validated fragments. (A) Crystal structure of BAZ2A PHD in complex with ART tripeptide. Fo – Fc electron density map of the peptide is contoured at 3σ. The R2 side chain of the peptide is not visible in the electron density. (B) Close-up view of the interactions. (C) Druggable binding sites in BAZ2A PHD (PDB: 4QF2)10 identified by FTMap, shown as green mesh. Protein surface is colored according to the electrostatic potential. (D) Overlay of (15N–1H) HSQC spectra recorded on the apo form of 15N-BAZ2B PHD (blue) and after 5 mM fragment addition (red). Arrows represent the shift direction. (E) Chemical structures of the in silico fragments validated by HSQC. Fragments reporting binding by NMR to the histone pocket are shown in red, and fragments reporting binding by NMR to the back pocket are shown in blue.
