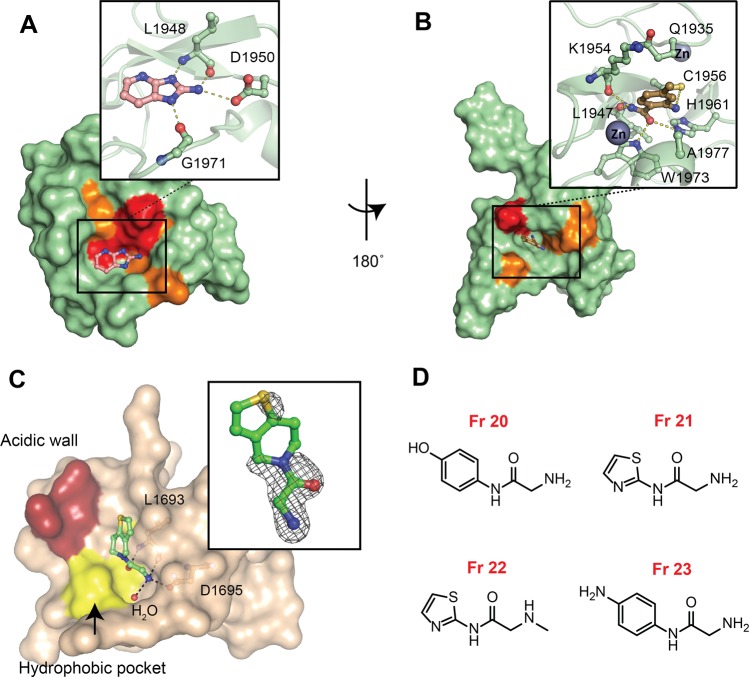
Figure 2.
Biophysical and structural validation of fragment hits. (A) Docking
pose of BAZ2B PHD and Fr3 showing a set of residues shifted
in HSQC and clustered at the histone pocket. Residues are colored
according to the intensity of the shifts: strong shifts in red (Δδ
>  + 2σ), intermediate shifts in orange
(Δδ >
  + σ) and lower shifts or no shifts
in green (Figure S3). (B) Docking pose
of BAZ2B PHD and Fr7 with shifts clustered at the back
pocket of BAZ2B and close-up view of in silico predicted
interactions. (C) Crystal structure of BAZ2A PHD in complex with Fr19 (in sticks, with green carbons). Fo – Fc electron density
map is contoured at 3 σ around the bound fragment. The Thr3
methyl hydrophobic pocket is colored in yellow, and the acidic wall
is red. (D) Chemical structures of optimized fragments.

