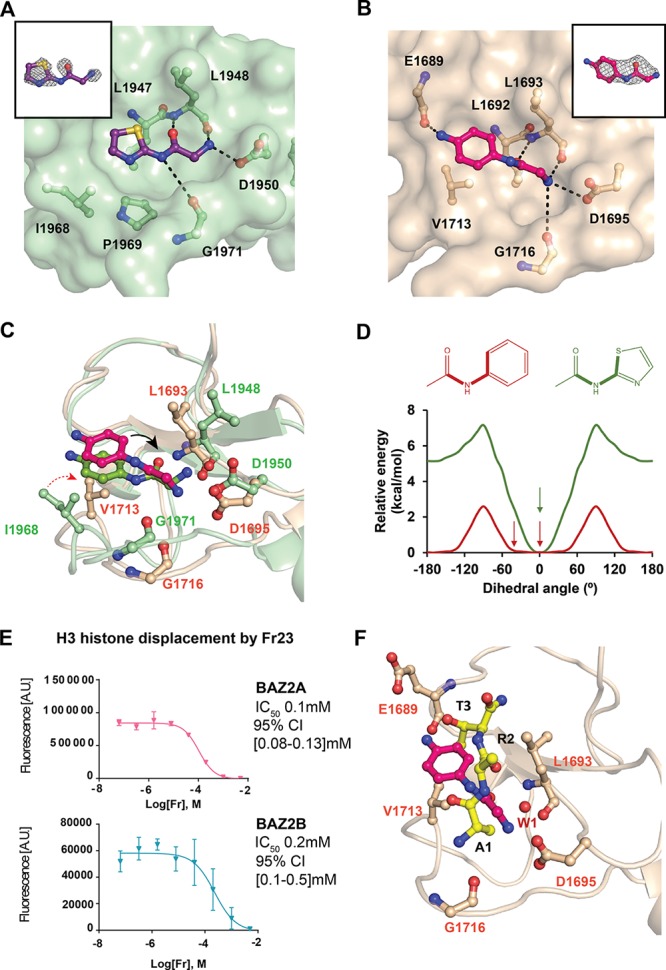
Figure 3.

Insights on the binding mode of optimized fragments. (A) Crystal structure of BAZ2B PHD in complex with Fr21 bound to the histone pocket. (B) Crystal structure of BAZ2A PHD in complex with Fr23 bound to the histone pocket. Fo – Fc electron density map of the fragments is in gray and contoured at 2.5σ. (C) Superposition of BAZ2 PHDs in complex with Fr23. The black arrow shows the dihedral angle. The red arrow shows the different orientation of Val1713 in BAZ2A and Ile1968 in BAZ2B. (D) Relative torsion energy of surrogate arylamides. The observed dihedral angles of the parent compounds in complex with BAZ2 are highlighted with an arrow. (E) AlphaLISA dose–response curves of Fr23. The error bars represent the standard deviation of each point (see the Supporting Information for more details). (F) Superposition of BAZ2A in complex with Fr23 and ART peptide.
