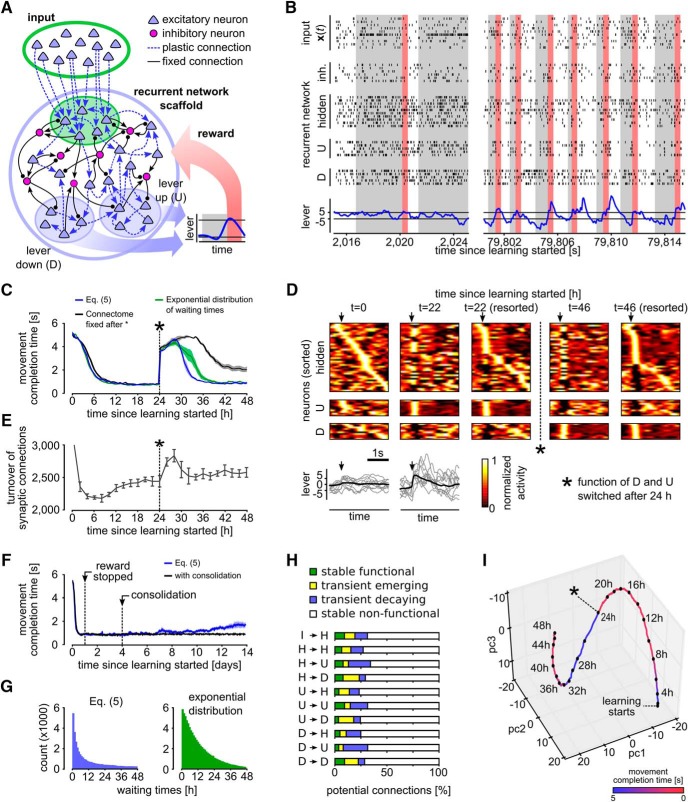
Figure 3.
Reward-based self-configuration and compensation capability of a recurrent neural network. A, Network scaffold and task schematic. Symbol convention as in Figure 1A. A recurrent network scaffold of excitatory and inhibitory neurons (large blue circle); a subset of excitatory neurons received input from afferent excitatory neurons (indicated by green shading). From the remaining excitatory neurons, two pools D and U were randomly selected to control lever movement (blue shaded areas). Bottom inset, Stereotypical movement that had to be generated to receive a reward. B, Spiking activity of the network at learning onset and after 22 h of learning. Activities of random subsets of neurons from all populations are shown (hidden: excitatory neurons of the recurrent network, which are not in pool D or U). Bottom, Lever position inferred from the neural activity in pools D and U. Rewards are indicated by red bars. Gray shaded areas indicate cue presentation. C, Task performance quantified by the average time from cue presentation onset to movement completion. The network was able to solve this task in <1 s on average after ∼8 h of learning. A task change was introduced at time 24 h (asterisk; function of D and U switched), which was quickly compensated by the network. Using a simplified version of the learning rule, where the reintroduction of nonfunctional potential connections was approximated using exponentially distributed waiting times (green), yielded similar results (see also E). If the connectome was kept fixed after the task change at 24 h, performance was significantly worse (black). D, Trial-averaged network activity (top) and lever movements (bottom). Activity traces are aligned to movement onsets (arrows); y-axis of trial-averaged activity plots are sorted by the time of highest firing rate within the movement at various times during learning: sorting of the first and second plot is based on the activity at t = 0 h, third and fourth by that at t = 22 h, fifth is resorted by the activity at t = 46 h. Network activity is clearly restructured through learning with particularly stereotypical assemblies for sharp upward movements. Bottom: average lever movement (black) and 10 individual movements (gray). E, Turnover of synaptic connections for the experiment shown in D; y-axis is clipped at 3,000. Turnover rate during the first 2 h was around 12,000 synapses (∼25%) and then decreased rapidly. Another increase in spine turnover rate can be observed after the task change at time 24 h. F, Effect of forgetting due to parameter diffusion over 14 simulated days. Application of reward was stopped after 24 h when the network had learned to reliably solve the task. Parameters subsequently continue to evolve according to the SDE (Eq. 5). Onset of forgetting can be observed after day 6. A simple consolidation mechanism triggered after 4 days reliably prevents forgetting. G, Histograms of time intervals between disappearance and reappearance of synapses (waiting times) for the exact (upper plot) and approximate (lower plot) learning rule. H, Relative fraction of potential synaptic connections that were stably nonfunctional, transiently decaying, transiently emerging or stably function during the relearning phase for the experiment shown in D. I, PCA of a random subset of the parameters θi. The plot suggests continuing dynamics in task-irrelevant dimensions after the learning goal has been reached (indicated by red color). When the function of the neuron pools U and D was switched after 24 h, the synaptic parameters migrated to a new region. All plots show means over five independent runs (error bars: SEM).

