Fig. 1.

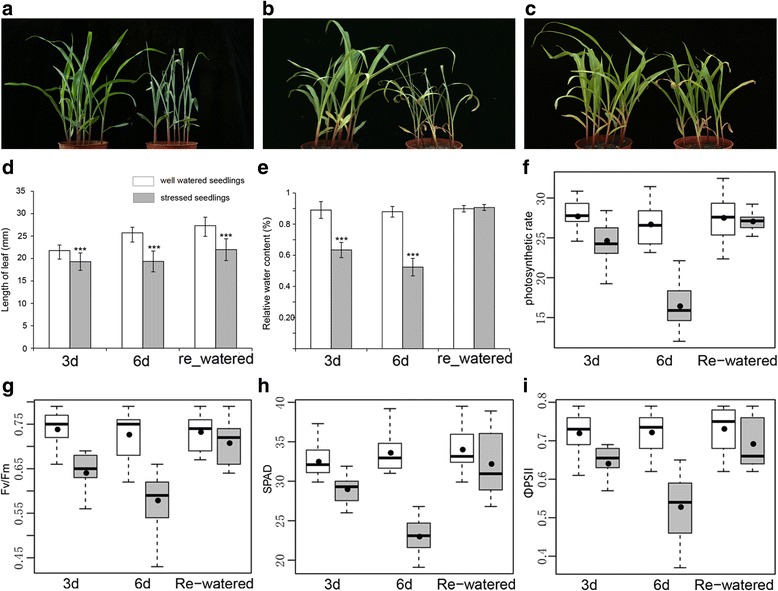
Physiological responses of seedling leaves affected by drought treatments and the water recovery period. Phenotypic responses of B73 seedlings to drought stress (DS) and water recovery treatments at different time points (a: 3-day drought; b: 6-day drought; c: 1-day water recovery). The pots on the right and left correspond to the drought-treated and well-watered control plants, respectively. The relative water content and leaf length were measured using seedling leaves after a 3-day (3d) or 6-day drought treatment (6d) and a 1-day water recovery period (re-watered, d and e). The values in d and e are presented as the mean ± standard deviation of three biological replicates, with each replicate consisting of three plants. The asterisks indicate significant differences (P < 0.001) according to the Student’s t-test. The leaf length (d), relative water content (e), photosynthetic rate (f), Fv/fm (g), SPAD (h), and ΦPSII (i) values were recorded for drought-treated (grey) and control seedlings (white) at three time points. All measurements were completed with the third seedling leaf
