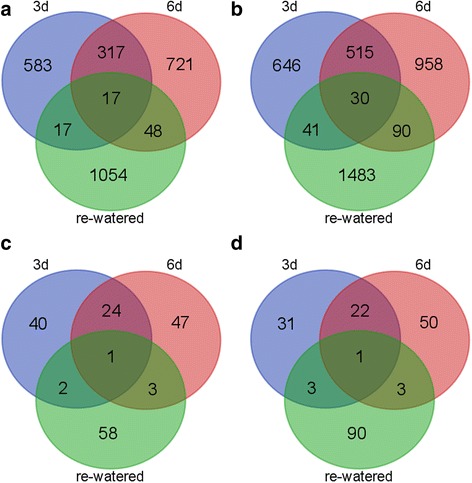
Fig. 2.

Global gene expression profiles and the identification of DEGs in response to the treatments. Venn diagrams illustrate the overlap between the differentially expressed genes identified following the 3-day drought, 6-day drought, and 1-day water recovery treatments. Up-regulated genes (a). Down-regulated genes (b). Up-regulated TF genes (c). Down-regulated TF genes (d)
