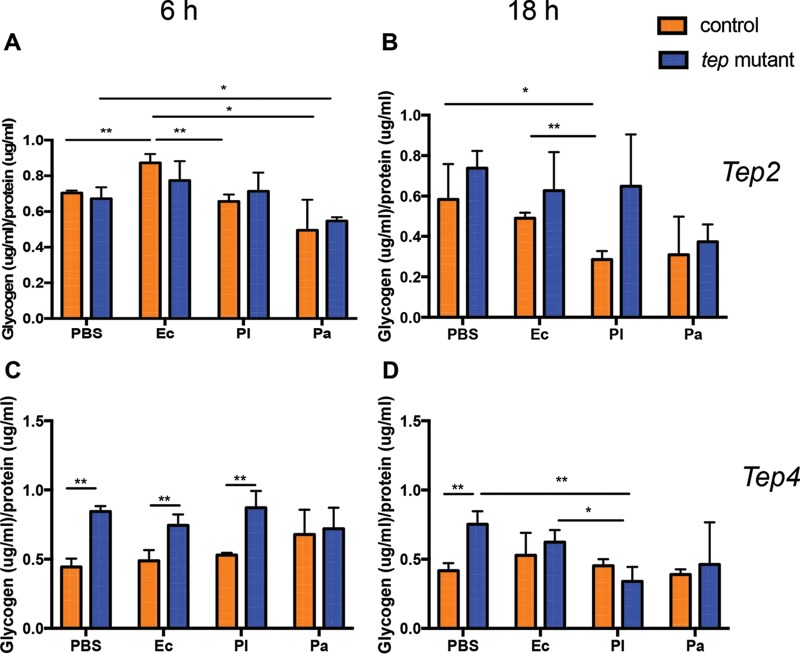
FIG 2.
Drosophila mutants for Tep2 and Tep4 display differential glycogen levels in the presence or absence of Photorhabdus infection. Shown are glycogen levels in tep loss-of-function mutants and background control flies (n = 5) injected with 1× PBS (negative control), E. coli (Ec), P. luminescens (Pl), or P. asymbiotica (Pa). Glycogen levels (micrograms) are normalized to the protein content (micrograms) and represented as a ratio in tep2 mutants (A and B) and tep4 mutants (C and D) compared to those of their background control strains (w1118 and yw, respectively) at 6 and 18 h postinjection. The means from three independent experiments are shown, and error bars represent standard deviations. Significant differences are shown with asterisks (*, P < 0.05; **, P < 0.01).

