FIG 3.
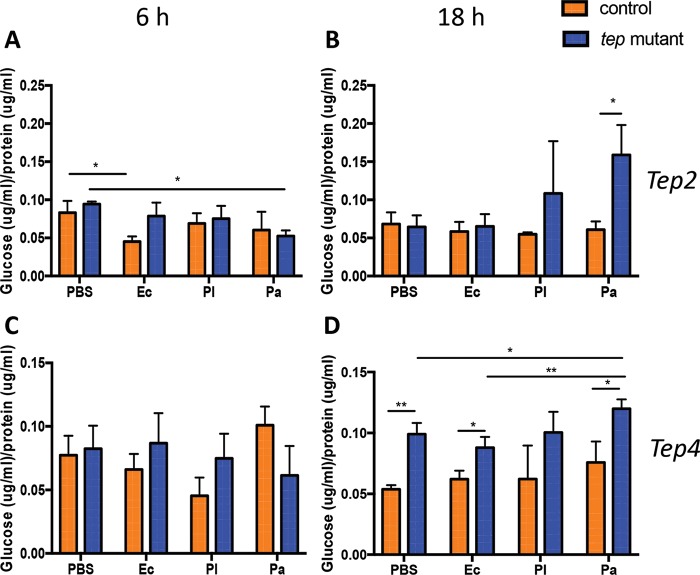
Drosophila mutants for Tep2 and Tep4 have altered glucose levels upon infection with Photorhabdus. Shown are free glucose levels in tep2 (A and B) and tep4 (C and D) loss-of-function mutant flies compared to those in the corresponding background controls (w1118 and yw, respectively) (n = 5) 6 and 18 h after infection with E. coli (Ec), P. luminescens (Pl), or P. asymbiotica (Pa) or injection with 1× PBS (negative control). Glucose levels are normalized to the total protein content and represented as a ratio of the total glucose content to the total protein content. The means from three independent experiments are shown, and error bars represent standard deviations. Significant differences are shown with asterisks (*, P < 0.05; **, P < 0.01).

