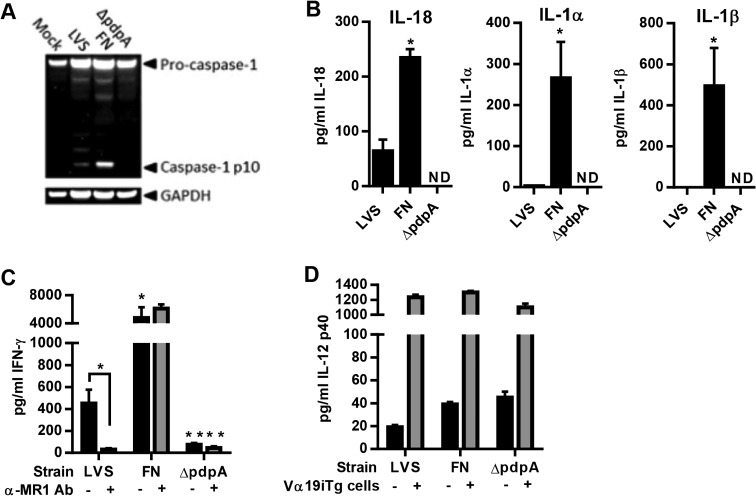
FIG 2.
Differences in the magnitude of inflammasome activation by F. tularensis LVS and F. novicida-infected macrophages reflect the magnitude of Vα19iTg T cell IFN-γ production. (A) WT macrophages infected with either no bacteria (Mock), LVS, F. novicida (FN), or F. novicida ΔpdpA (MOI, 100:1) for 20 h. Western blot analysis of culture supernatants was performed to visualize active caspsase-1 (caspase-1 p10). The blot was reprobed for GAPDH, which was used as a loading control. (B) WT macrophages were infected with either LVS, F. novicida, or F. novicida ΔpdpA (MOI, 100:1). The levels of IL-18, IL-1α, and IL-1β were examined in the supernatants after 20 h of culture. *, P < 0.01 compared to LVS; ND, not detected. (C) WT macrophages were infected with either LVS (MOI, 1:1), F. novicida (MOI, 1:1), or F. novicida ΔpdpA (a MOI of 100:1 was used since ΔpdpA does not grow well in macrophages) and cocultured with Vα19iTg T cells in the presence and absence of blocking anti-MR1 Ab or matched-isotype control Ab (25 μg/ml). IFN-γ was measured in the supernatants after 20 h of culture. *, P < 0.01 compared to LVS; **, P < 0.01 compared to wild-type F. novicida. (D) IL-12 p40 levels in the supernatants of macrophage cultures infected with either LVS (MOI, 1:1), F. novicida (MOI, 1:1), or F. novicida ΔpdpA (MOI, 100:1) in the presence (+) and absence (−) of Vα19iTg T cells for 20 h. Data represent values ± SEM from three replicates and are representative of three independent experiments.

