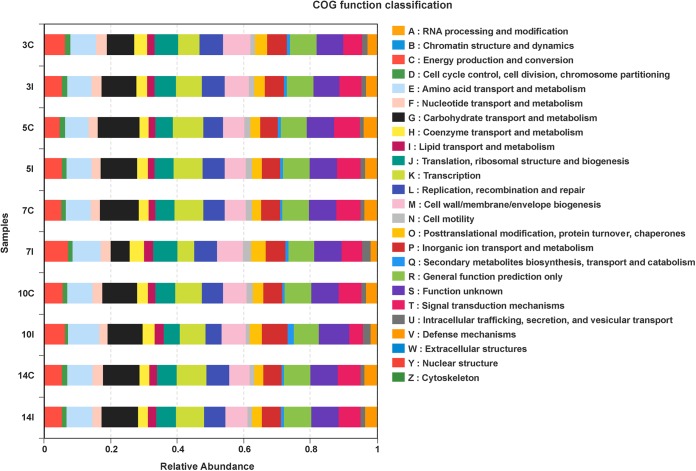
FIG 4.
COG category analysis of the cecal microbiota for infected and control mice. COG analysis revealed the relative abundances of metabolic functions that differed between infected and control mice. Each sample is designated by the number representing the day of collection (day 3, 5, 7, 10, or 14), followed by the letter C (control) or I (infected).

