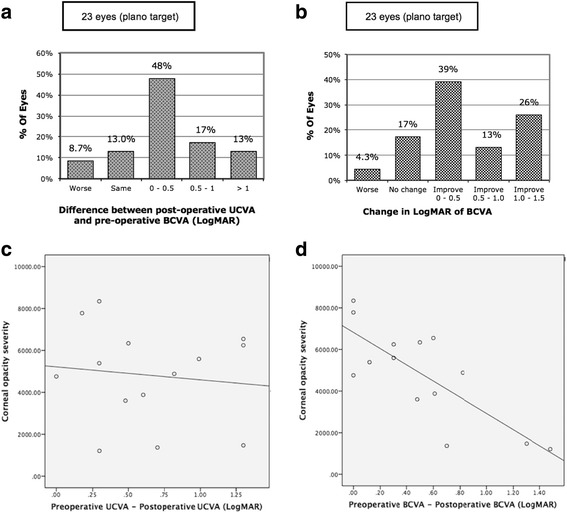
Fig. 2.

Visual outcomes and the correlation with severity of corneal opacity after cataract surgery in eyes with visually debilitating cataracts and coexisting corneal opacities. a Comparison of pre-operative BCVA and post-operative UCVA in logMAR, histogram representing efficacy of cataract surgeries. b Comparison of pre-operative BCVA and post-operative BCVA in logMAR, histogram demonstrating safety of surgeries in our cases; only one case (4.3%) become worse in visual performance. c There was a statistically significantly negative linear relationship and strong correlation in terms of BCVA (r = − 0.782, P = 0.001); d there was a mildly significantly negative linear relationship and weak correlation regarding UCVA (r = − 0.118, P = 0.688). (BCVA = best corrected visual acuity; UCVA = uncorrected visual acuity)
