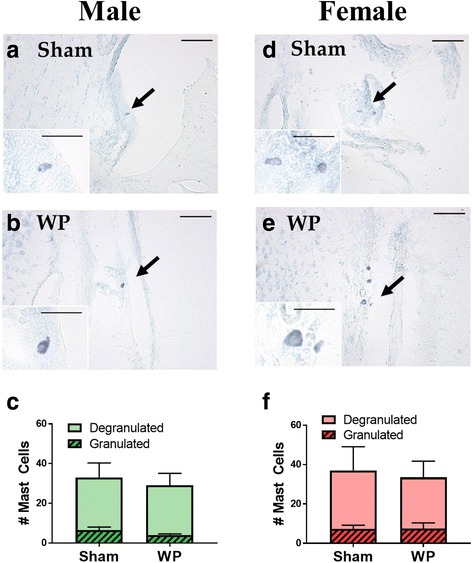
Fig. 9.

TB staining and quantitation of mast cells in the old mouse brains. For the photomicrographs a, b, d, and e, paraformaldehyde-fixed brains from old sham (a, d) and WP-sensitized (b, e) male (a, b) and female (d, e) mice were coronally frozen-sectioned at 40 μm and stained with TB. The lower left insets in the panels a, b, d, and e show the cells indicated with the arrows at a higher magnification. The images in the panels were taken with a ×20 objective (scale bar = 50 μm), whereas the insets were taken with a ×40 objective (scale bar = 20 μm). Quantitative comparisons show the number of granulated (hashed bars) and degranulated (open bars) mast cells observed in male (c) and female (f) brain sections. Values indicate group average ± standard error (n = 4)
