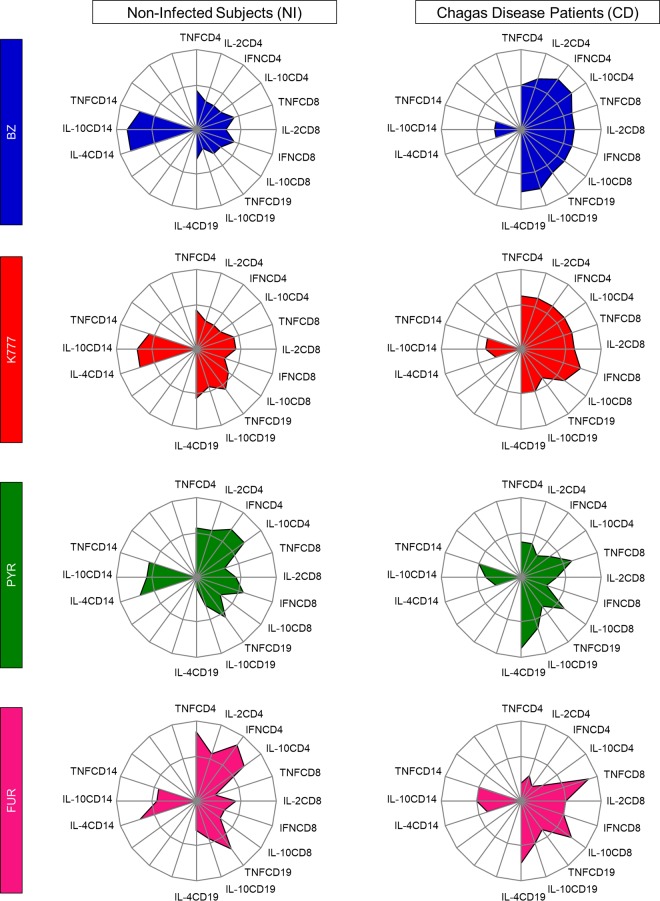
FIG 5.
Drug-induced changes on in vitro intracytoplasmic cytokine signatures of innate and adaptive immunity. Radar graphs represent the balance of subjects with a high frequency of inflammatory (IL-2, TNF, IFN) or regulatory (IL-10, IL-4) cytokine-producing cells of innate (CD14) and adaptive (CD4, CD8, CD19) immunity. Graphs were constructed with each axis displaying the proportion of subjects with a high frequency of cytokine-producing cells within a given leukocyte subset. The values of each axis can be joined to form the central polygon area that represents the general inflammatory/regulatory cytokine balance. Increasing or decreasing central polygon areas reflect either higher or lower contributions, respectively, of the inflammatory versus regulatory cytokine balance in each group. Analysis of the radar chart axes highlights the contribution of a distinct leukocyte subset for the overall cytokine balance after treatment with BZ (blue), K777 (red), PYR (green), and FUR (pink) lead compounds. Groups were categorized as noninfected subjects (NI, n = 18) and Chagas disease patients (CD, n = 20).

