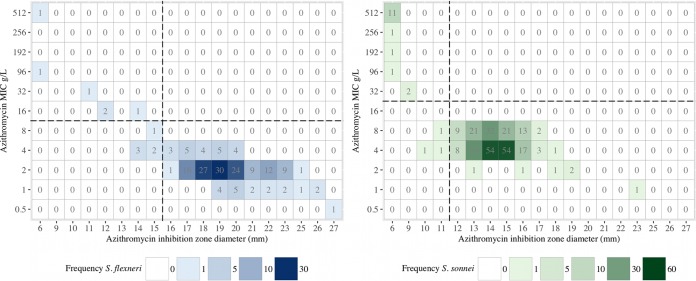
FIG 2.
Relationship between azithromycin MIC and inhibition zone size in Southeast Asian Shigella spp. The plots show the relationship between inhibition zone size (x axis) and the MIC (y axis) for azithromycin in S. flexneri (left) and S. sonnei (right). The squares are colored with respect to the number of isolates in each group, and the number of isolate in each group is additionally provided.

