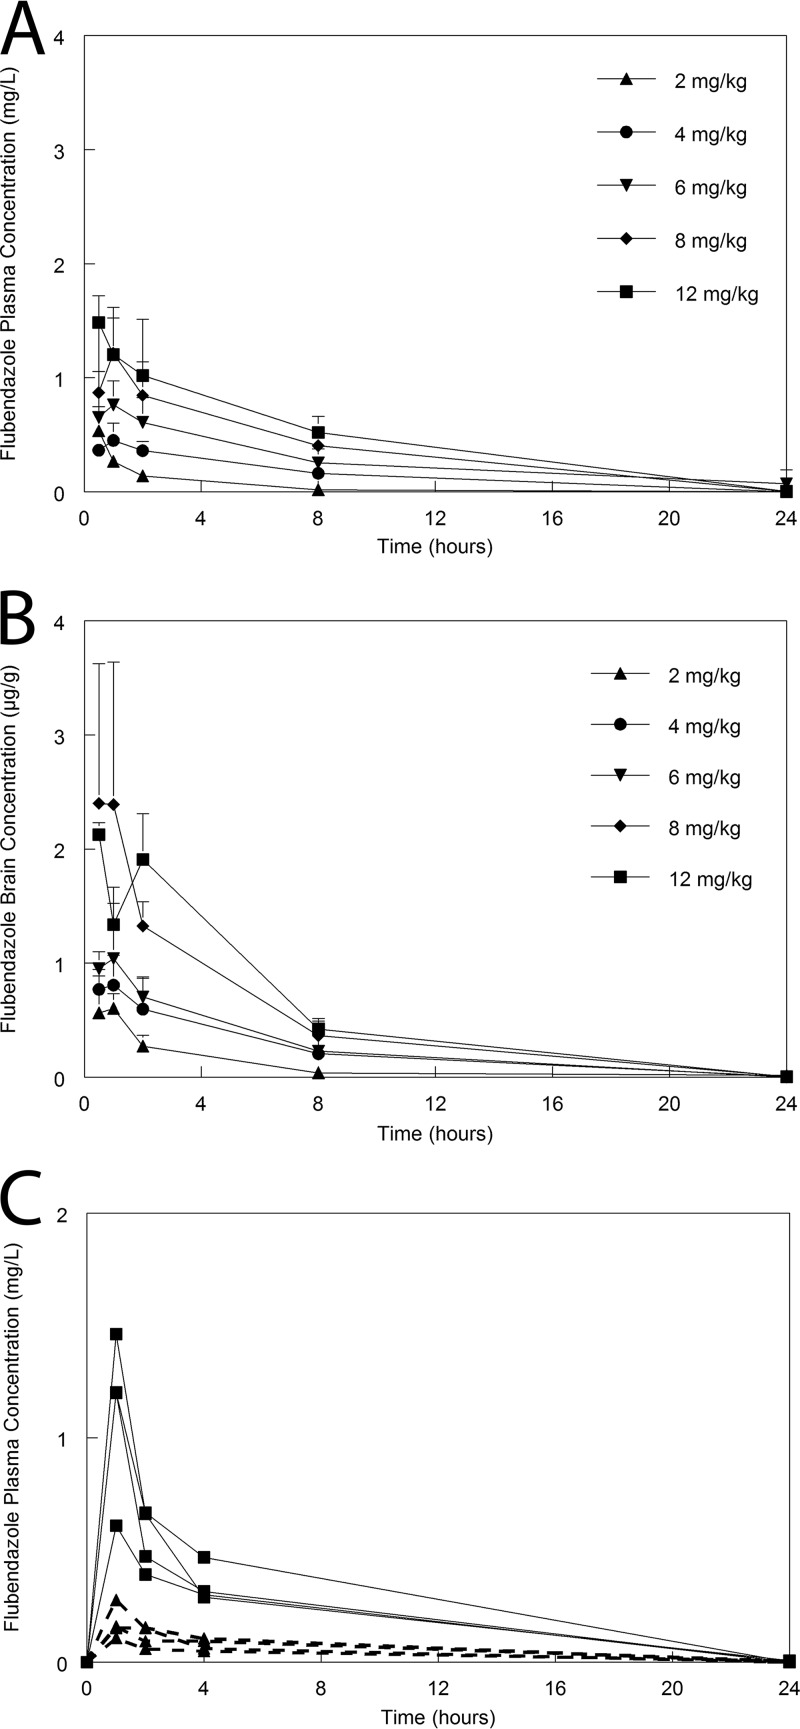
FIG 3.
Flubendazole pharmacokinetics in mice and rabbits. (A) Mouse plasma concentration-time profiles following the administration of flubendazole at 2, 4, 6, 8, and 12 mg/kg. (B) Mouse concentration-time profiles in the brain following the administration of flubendazole at 2, 4, 6, 8, and 12 mg/kg. Data are means ± SDs for 3 mice. (C) Plasma pharmacokinetics in the serum for individual rabbits receiving 6 mg/kg/day (broken lines and solid triangles) and 22.5 mg/kg (solid lines and solid squares).

