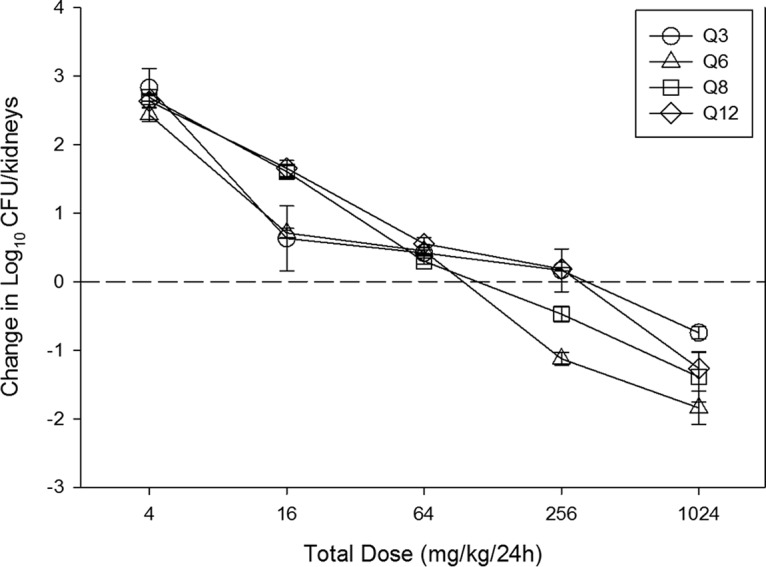
FIG 2.

Relationship between the APX001 dosing interval and efficacy against C. albicans K1 in a murine neutropenic disseminated candidiasis model. Each symbol represents the mean ± SD for three animals. The error bars represent the standard deviations. The dashed horizontal line represents net stasis over the treatment period. Points above the line represent net growth, and points below the line represent net killing (cidal activity).
