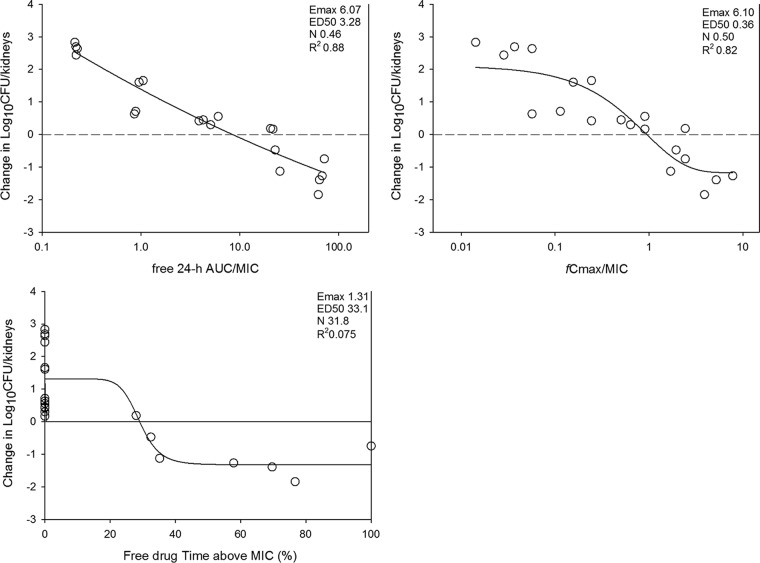
FIG 3.
Pharmacodynamic regression of the in vivo dose fractionation study with APX001 against C. albicans K1. Each symbol represents the mean and standard deviation for three mice. The dose data are expressed as fAUC0–24/MIC, fCmax/MIC, and the percentage of the dosing interval during which plasma free-drug levels exceeded the MIC for each of the dosage regimens studied (TMIC). R2 is the coefficient of determination. Also shown for each PD index is the maximum effect (Emax), the PD index value associated with 50% of the maximum effect (ED50), and the slope of the relationship, or the Hill coefficient (N). The line drawn through the data points is the best-fit line based upon the sigmoid Emax formula.

