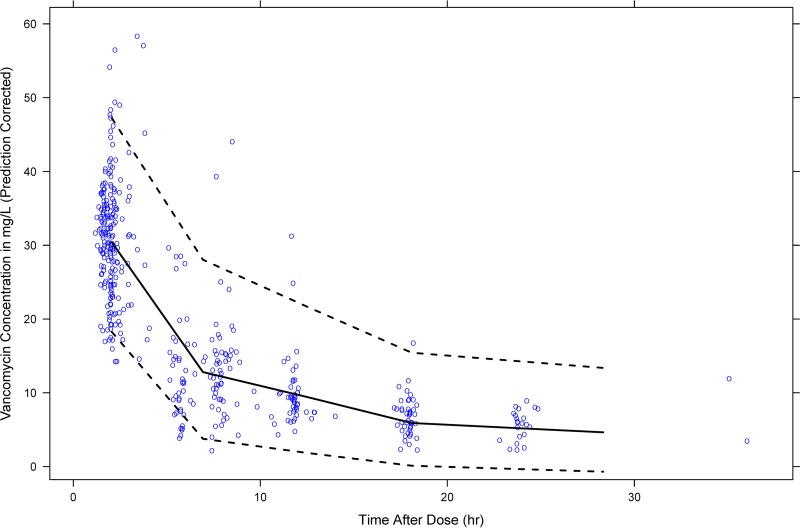
FIG 2.
Prediction-corrected VPC for the final population pharmacokinetic model. The 50th (bold black line) and the 2.5th and 97.5th (dashed black lines) percentiles of simulated concentrations were overlaid on observed concentrations (opened blue circles). Note that 7.69% of the observed concentrations fell outside the 95% prediction interval.

