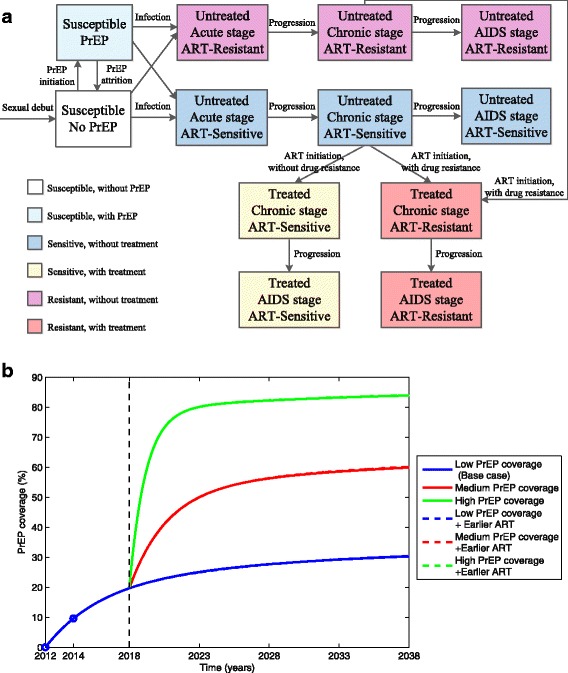
Fig. 1.

a Flow diagram of the HIV transmission dynamics with PrEP and ART interventions, incorporating the acquisition and transmission of drug resistance following ART. b Low, medium, and high PrEP coverage scenarios in the San Francisco MSM population. PrEP coverage increased to an estimated 9.6% (blue circle) of San Francisco’s MSM population by 2014 [8] after the Food and Drug Administration approved PrEP in 2012. Projection to 2023 of this rate of increase yields a PrEP coverage of 25% in 2023 (low PrEP scenarios). Efforts to further expand PrEP coverage were modelled by identifying a constant PrEP initiation rate that yielded coverage levels that saturated at 50% (medium PrEP coverage) and 80% (high PrEP coverage) by 2023. Earlier initiation of ART minimally affects PrEP coverage projections because, while it leads to increases in the number of susceptible individuals and, consequently, the numbers of PrEP users (Additional file 1: Figure S2), their ratio (i.e., PrEP coverage) remains relatively unchanged. PrEP pre-exposure prophylaxis, ART antiretroviral therapy, MSM men who have sex with men
